Intermediate Analysis with Excel
If you have any questions or get stuck as you work through this in-class exercise, please ask the instructor for assistance. Have fun!
In addition, if you think you would find it helpful, here is a step-by-step video tutorial for this activity as a suplement to the steps below.
- Log in to Taguette and open your project so you can see your documents. Then select the Highlights tab.
-
Next click on the See all highlights button to view summaries of all of the passages that you coded.

- Exporting your Passages in Preparation for Writing Up Your Research: You can export all of your coded passages to your computer to help with synthesis and writing.
- In Highlights tab, click See all highlights.
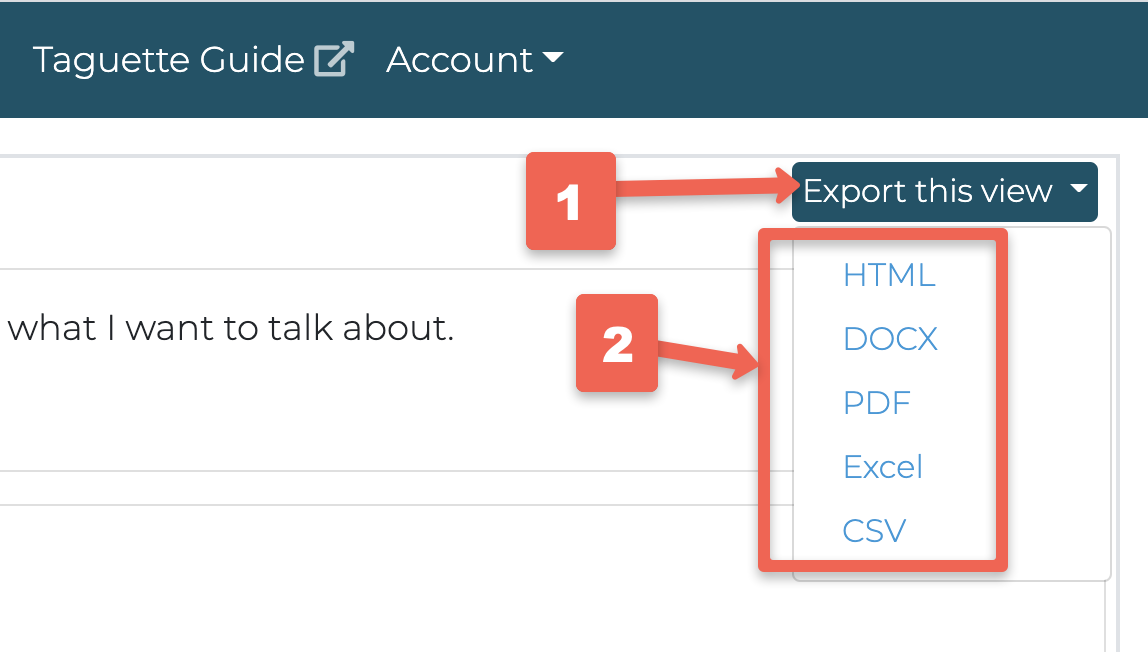
- In the top right corner of the screen, click the “Export this view” dropdown menu.
- Select Excel format to download your coded passages as a spreadsheet.
- Pivot Table to Count Tags: This will give you a high level summary of the number of times you use codes or tags across all the documents in your research project.
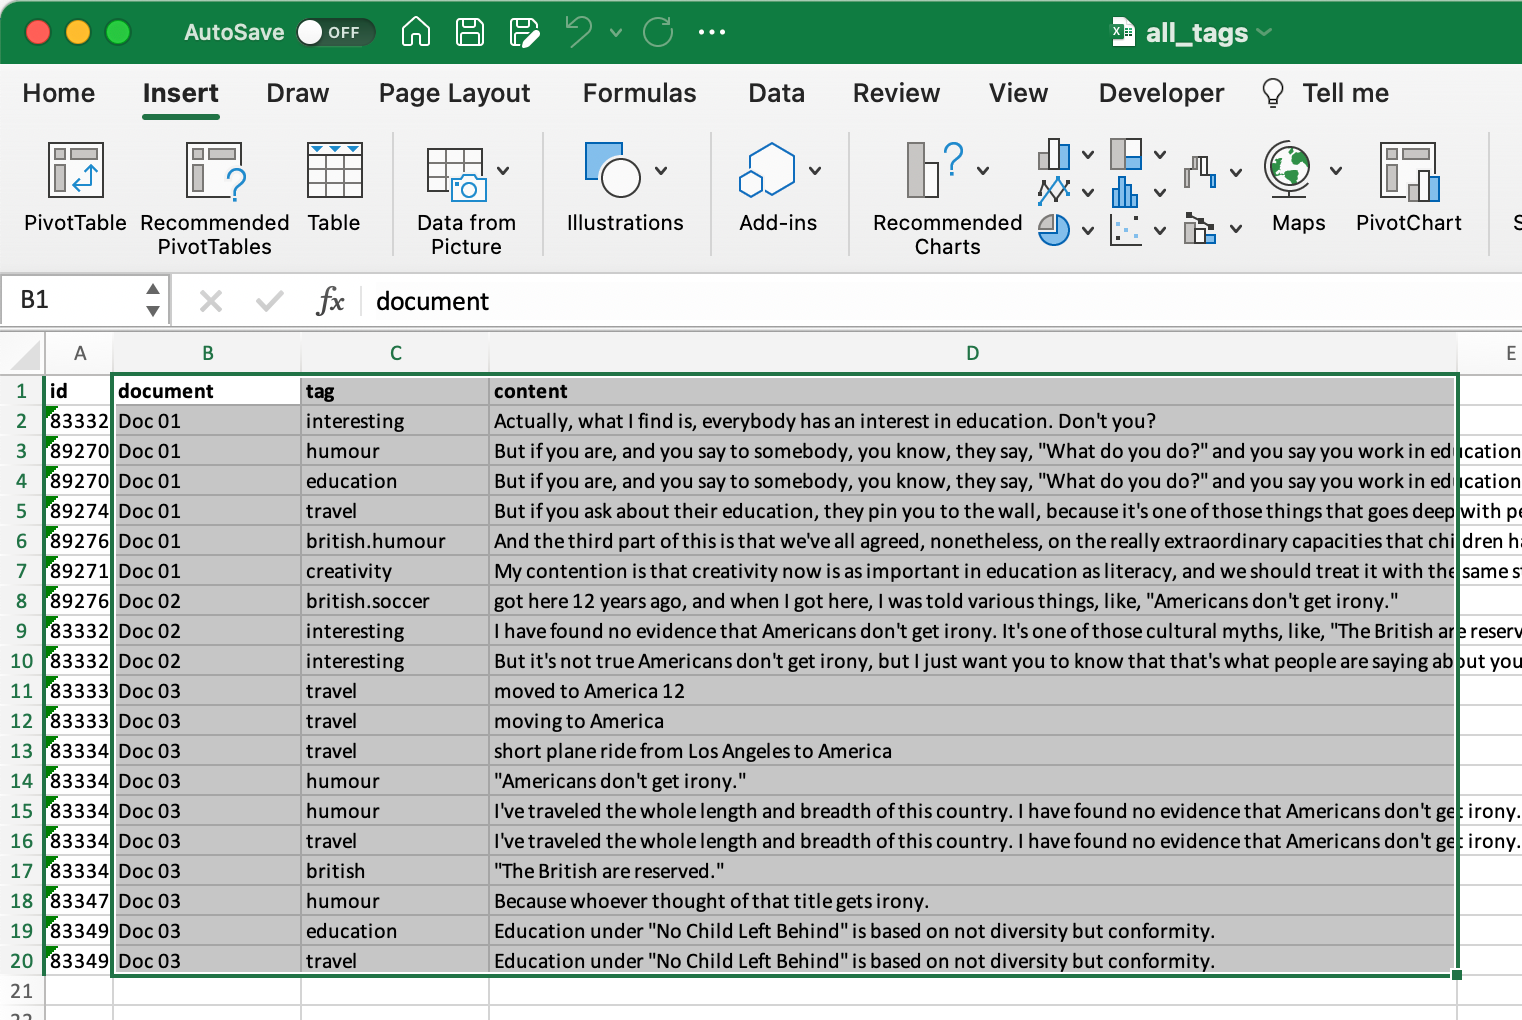
- Open up the Excel file you just downloaded to your computer.
-
In the Excel file, select the document, tag, and content columns, including all rows of data.
-
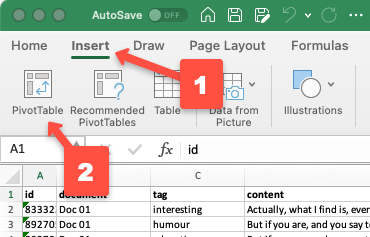
Next, click on the Insert tab and select Pivot Table. You can use the default settings and click OK.
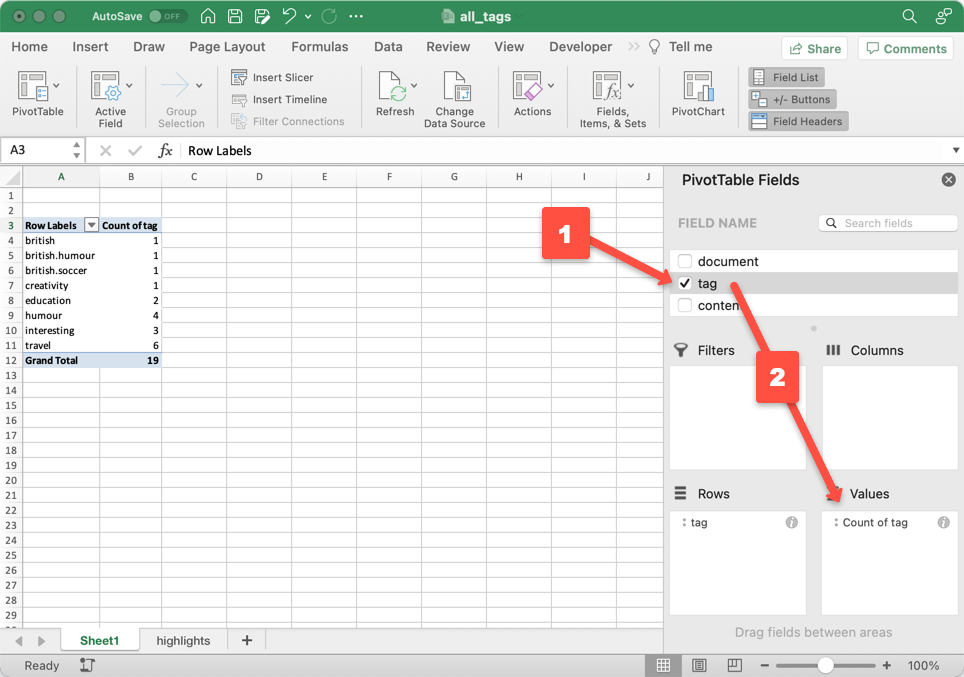
- In the PivotTable Fields panel on the right-hand side:
- Check the box next to tag.
- Then drag tag into the Values area below.
- This will generate a count of how many times each tag was used.
- Pivot Table to Count Tags in Each Document. This step will create a summary showing how many times each code or tag appears within each individual document.
- Return to the original worksheet (usually called “highlights”) at the bottom of the Excel file.
-
Again, select the document, tag, and content columns, including all data.
-
Click on the Insert tab and select Pivot Table. Use the default settings and click OK to create a new pivot table.
-
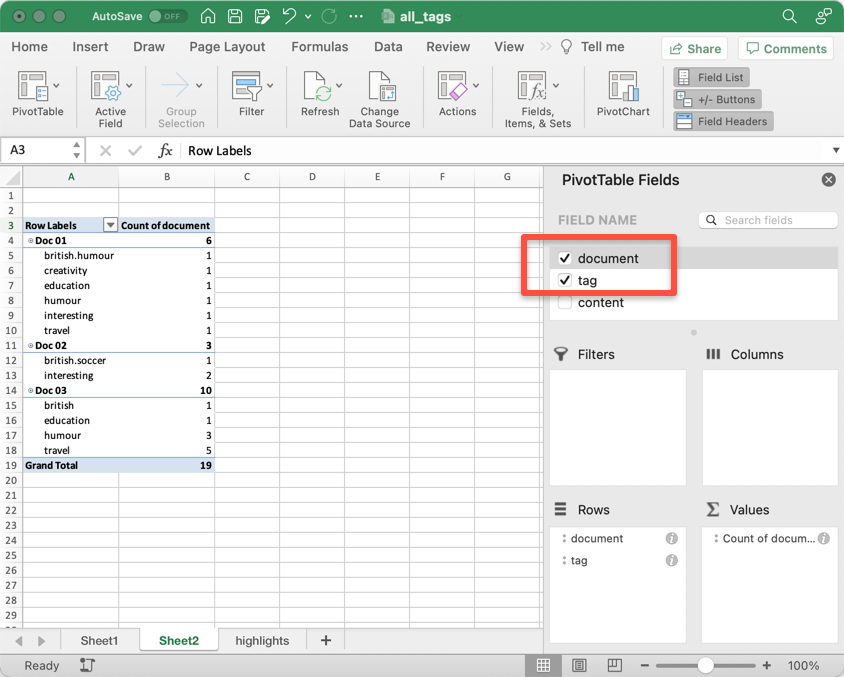
In the PivotTable Fields panel on the right-hand side, check both the document and tag checkboxes.
-
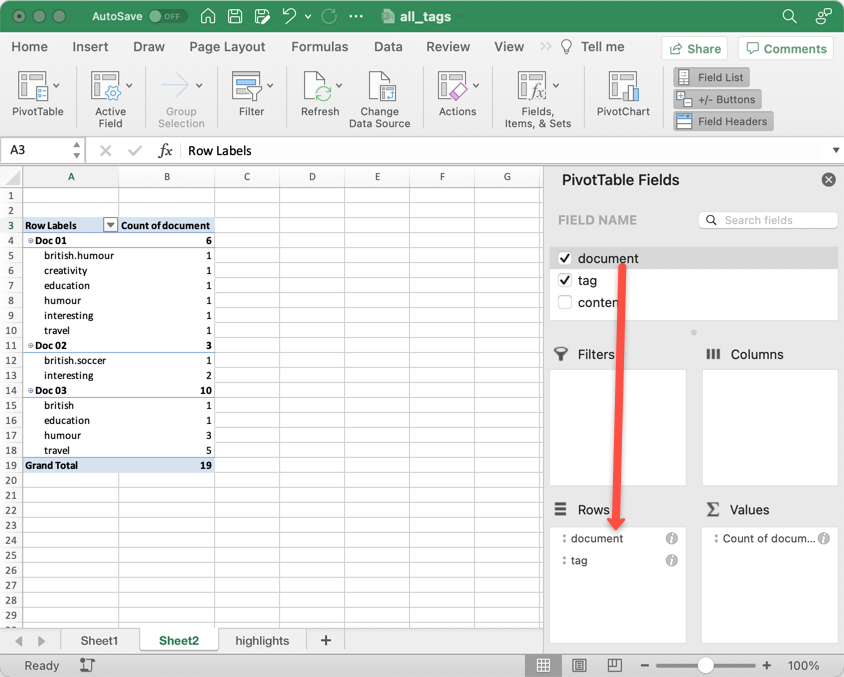
Drag the document to the Rows area. (This will shows how many tags appear in each document).
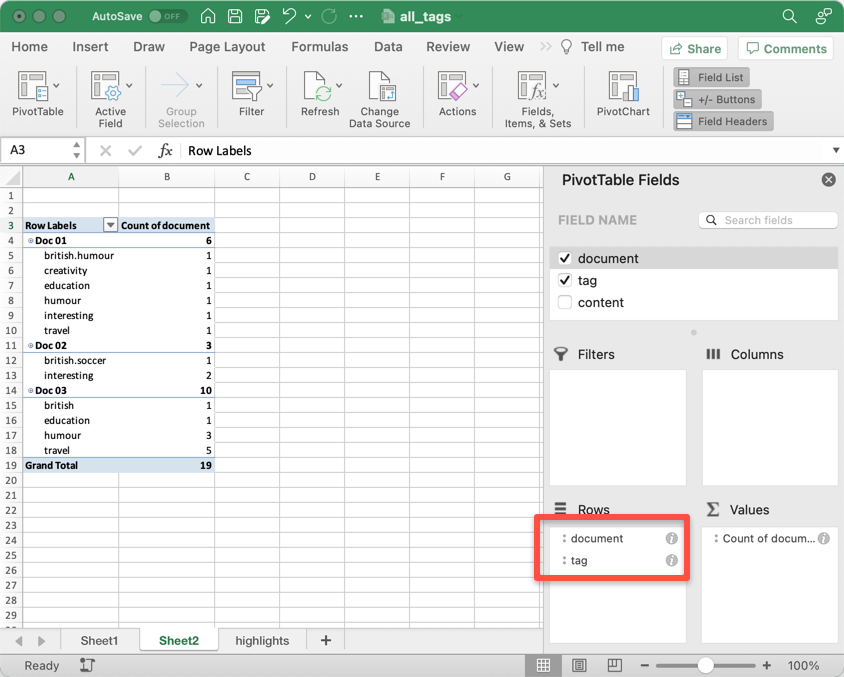
- In the Rows area, drag the tag field so that it appears below the document field. (This will display a detailed breakdown of tag counts within each document.)
You should now have some summary quantitative data that will hopefully be useful to include with the qualitative data that you created in Taguette. Great job!