
Visualization with Word Clouds
If you have any questions or get stuck as you work through this in-class exercise, please ask the instructor for assistance. Have fun!
In addition, if you think you would find it helpful, here is a step-by-step video tutorial for this activity as a suplement to the steps below.
-
Create a free account at the Word Art website.
Note: If you have just completed “Activity 4 – Excel Analysis” in this workshop, you can skip Steps 2-4 and proceed directly to Step 5.
-
Log in to Taguette and open your project so you can see your uploaded documents.
-
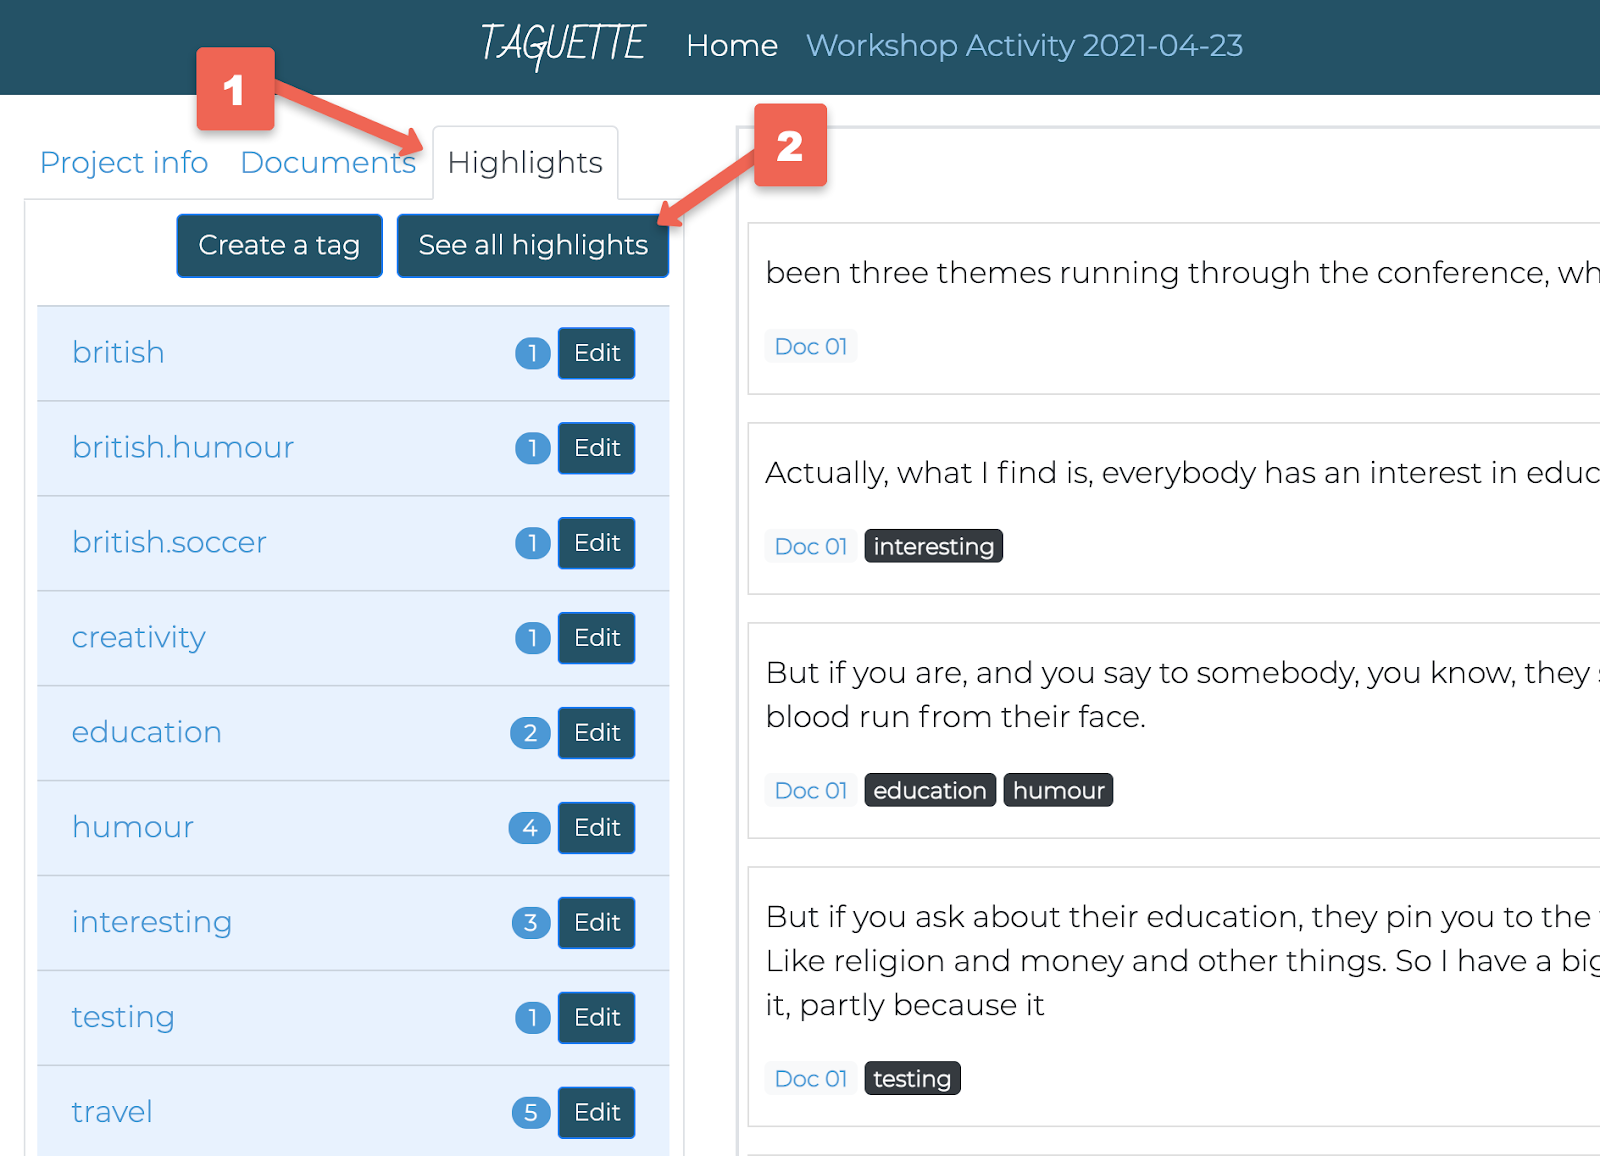
Select the Highlights tab, then click “See all highlights” to view a summary of all the passages you have coded.
- Exporting your Passages in Preparation for Writing Up Your Research: Exporting all your Passages with their Codes - You can export all your work back to your computer to facilitate the synthesis and write up of your coded data.
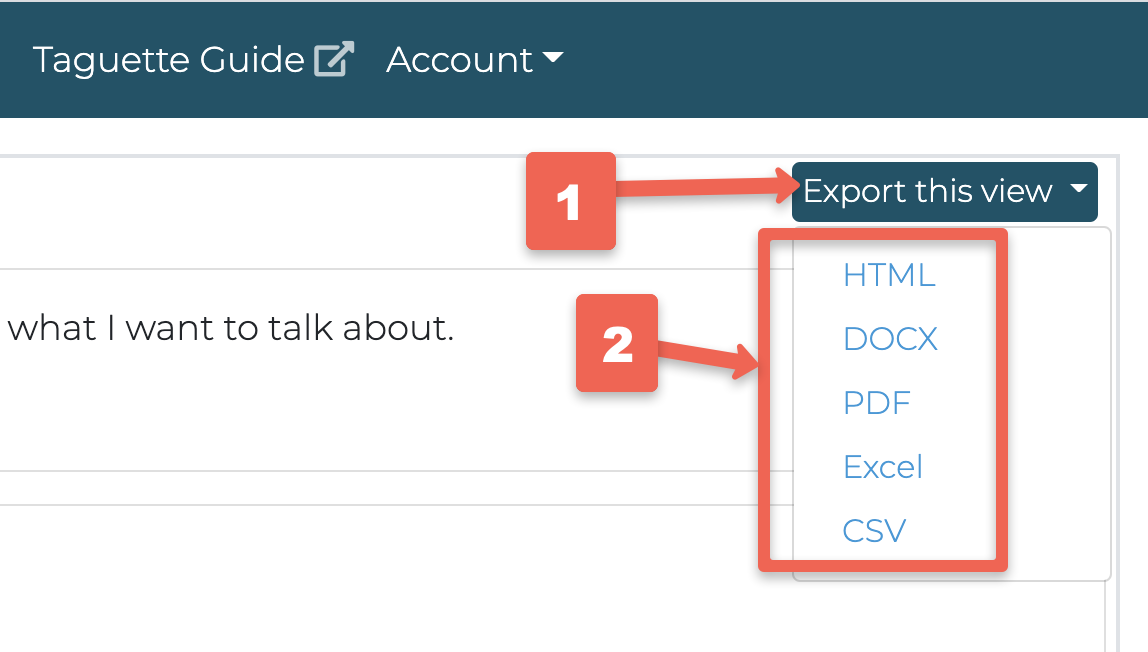
- Click on the Highlights tab, and then the See all highlights button.
- Look to the right of the screen and click on the Export this view button, and then select the export format to EXCEL.
-
Open up the Excel file that you downloaded from Taguette. (This file is usually located in your computer’s Downloads folder.)
- In the Excel file, locate the “tag” column.
- Click on the first cell under the header “tag” (for example, cell C1).
- Select all the cells in that column that contain tag names.
- Then copy the cells, go to Edit > Copy (or use Ctrl + C (Windows) / Cmd + C (Mac)) to copy the selected tags.
-
If you haven’t done so already, create a free account on the Word Art Website in a new tab. (You only need to do this once. If you already have an account, you can skip this step.)
-
After logginf into Word Art, click on Dashboard.
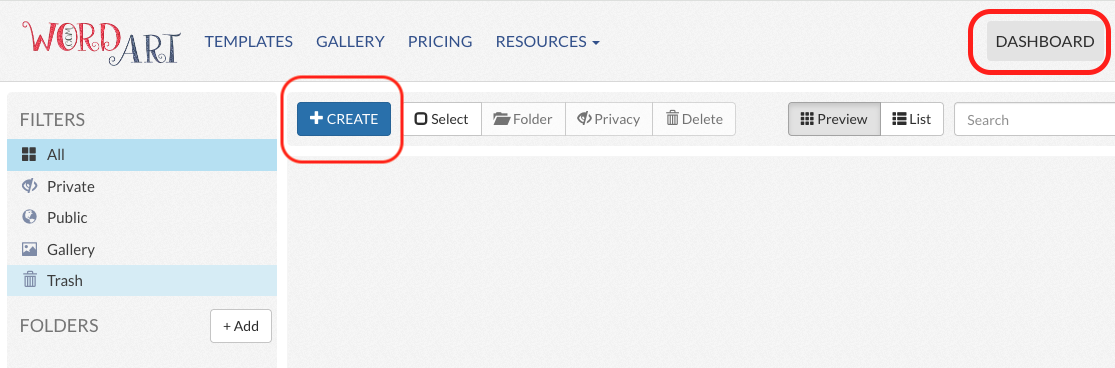
- On the Dashboard page, click the Create.
- You may see a “Create with AI” dialog box. For this activity, please ignore that option and select “Start from Scratch.”
-
In the editor screen, click the Import button.

- In the Import dialog box,
- Paste the data you copied from Excel (the list of tags) into the text field using Ctrl + V (Windows) or Cmd + V (Mac).
- Make sure to paste only the words, do not include the column headers (‘tag’).
- Then check the “CSV format” checkbox and confirm the import.
-
Click on Import Words to load the data you pasted.
-
The word art may generate automatically. (If it does not appear right away, click the red Generate button to create the word cloud using your imported words.)
- To make sure each word only appears once:
- Go to the Words tab.
- Click the Columns button (near the top of the word list).
- Make sure the Repeat column is checked so it becomes visible.
- In the word list, review the Repeat column and uncheck the box next to each word.
- This ensures that every word appears only once in your design.
-
Click Generate again to refresh the word art with the updated settings.
- To customize the appearance, use the left sidebar:
- Click on Fonts and select the font style you prefer.
- Click Generate once more to apply your changes. (Tip: If you don’t like the layout or arrangement, simply click Generate again to try a different variation.)
Using Pivot tables to Visualize all coded text (not just tag/code names) This will create a Word Cloud from Full Coded Content
-
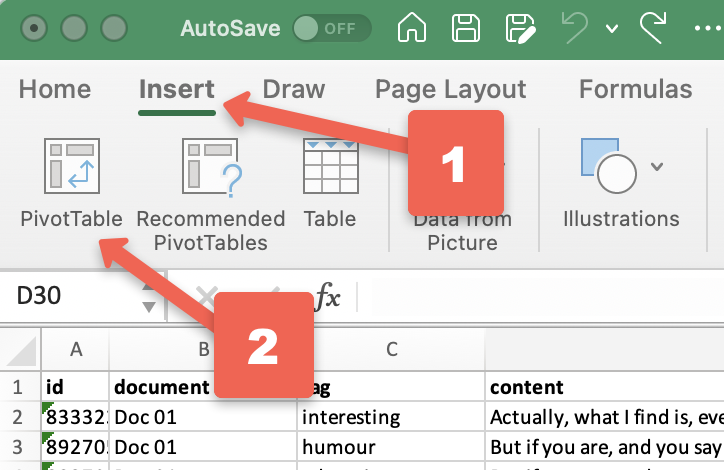
Return to Excel file and select the Content column (usually cell D1).
-
Select any cell inside the table, then go to the Insert tab in Excel and choose Pivot Table.
-
In the Create PivotTable dialog box, keep the default settings and click OK to create a new pivot table.
- In the PivotTable Fields panel on the right:
- Check the box next to Content to add it to the pivot table.
- Then drag Content into the Rows area so that all coded passages appear in the table.
-
Click inside the list of content displayed in the pivot table, then select all of the text. Copy the selected text using Edit > Copy (or Ctrl + C (Windows) / Cmd + C (Mac)).
-
Open the Word Art website in a new tab and create a new word art project. Follow Steps 7–14 from the previous section to start a new design and import text.
- Customize the Word Art Design. To change shape of your word cloud:
- In the left sidebar, click on Shapes.
- Select the shape you would like to use.
- Click the Generate button to apply the new shape and refresh the design.

- Download and save your Word Art. When you are happy with the design, go to the blue menu bar at the top of the Word Art window and click Download.

- From the dropdown menu, choose Standard PNG as the file format.
- Save the file with a clear name (for example: Taguette_WordArt_YourName.png) to your computer.
You should now have some visualizations that will hopefully be useful to include with the qualitative data that you have created in Taguette. Great job!