OPTIONAL: Interactive Data Dashboard With RShiny
In this activity, we explore interactive data dashboard building with the package shiny. Follow the official shiny tutorial that takes about 2.5 hours to complete: https://shiny.rstudio.com/tutorial/
-
Introduction
-
Install the package:
install.packages("shiny") library(shiny) -
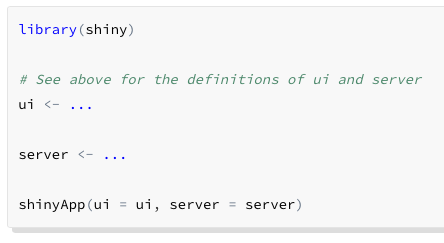
Shiny apps are contained in a single script
app.Rwhich has three components:- A user interface (ui) that contains the layout of the Shiny dashboard
- A server (server) that contains the code to manipulate data and create graphs
- A function to combine these two previous components
The Shiny package contains a few examples which display both the dashboards and the app.R scripts to create them. In practice, we don’t need to display the actual script as a part of the dashboard. Let’s give each of these a try. Exit each Shiny app by closing its window or hitting Escape on the keyboard.
runExample("01_hello") runExample("02_text") -
Check out other Shiny creations: https://shiny.rstudio.com/gallery/
-