Social Media Slides
Using infographic slides has become frequently used means of communicating via social media platforms such as Instagram. A recent article about this can be read here (which references the use of Canva), if you are unfamiliar with this and if you can’t access the article, here are some direct examples from Instagram that are linked in the article:
- https://www.instagram.com/p/CCVso-aHGuo/
- https://www.instagram.com/p/CCbb8bWAQNk/
- https://www.instagram.com/p/CB8bWrbnWeW/
In this exercise, we will go over the use of Canva for creating these slides (using the same data from the previous activities and building off the skills and graphics from those activities), and how to upload them to Instagram. Note: in many cases, you may want to have much more text than this activity uses in each page of your graphic (as is shown in some of the examples linked above). This activity only uses a small amount of text to keep things simple, but feel free to use more text for your own projects. Just be sure to test your infographics for readability. The nice thing about a regular Instagram post (rather than an Instagram Story) is that the slides can be zoomed in so that people can read smaller text. If you have any questions, please ask, and don’t forget to have fun!
-
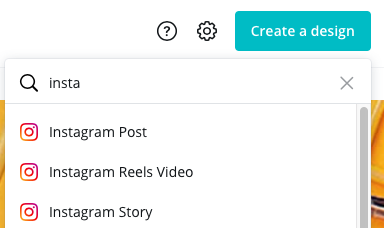
From the Canva home page, click on the teal Create a design button on the top right of the screen. Start typing Instagram and click on Instagram Post when it comes up as one of the options in the drop down results.
-
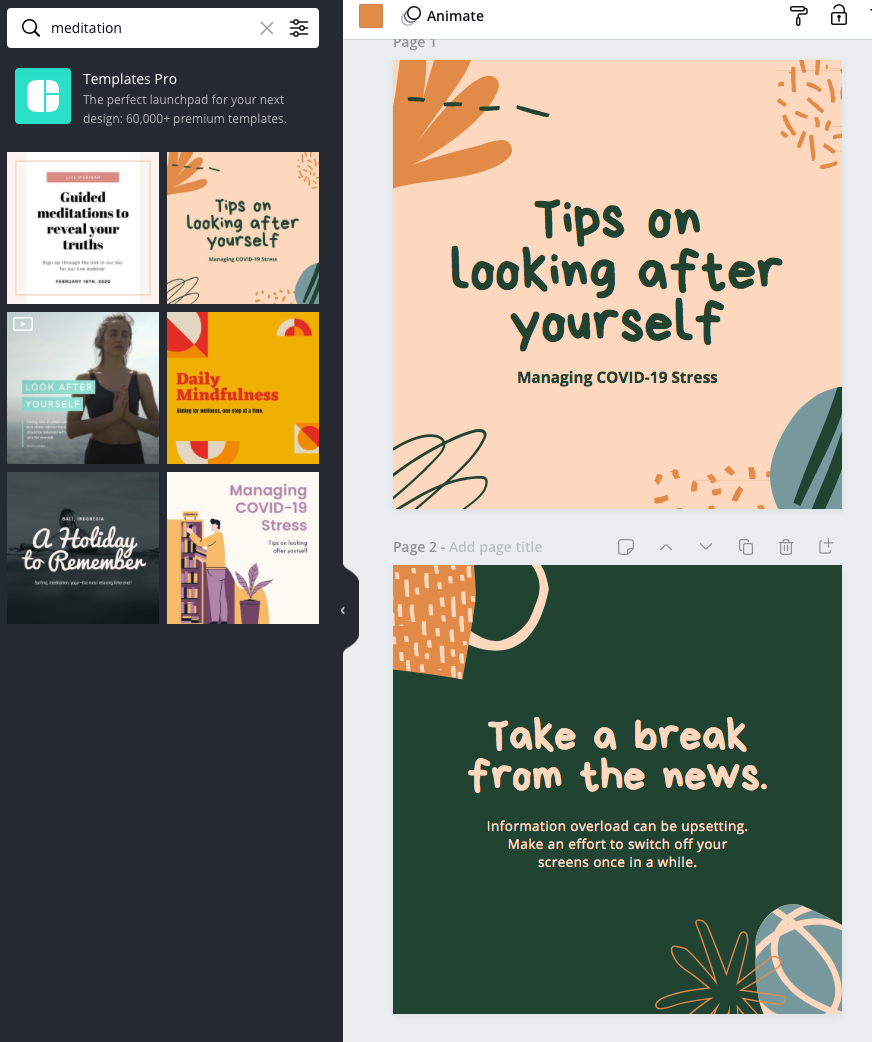
Type “meditation” in the search field on the left top and click on the peach and orange template (see image).

-
This exercise will use the template in the example to the right and put facts and statistics from this article on Meditation into the template in the form of graphics and text. If you decide to use a different template, please note that the instructions will differ from the template that you choose.
-
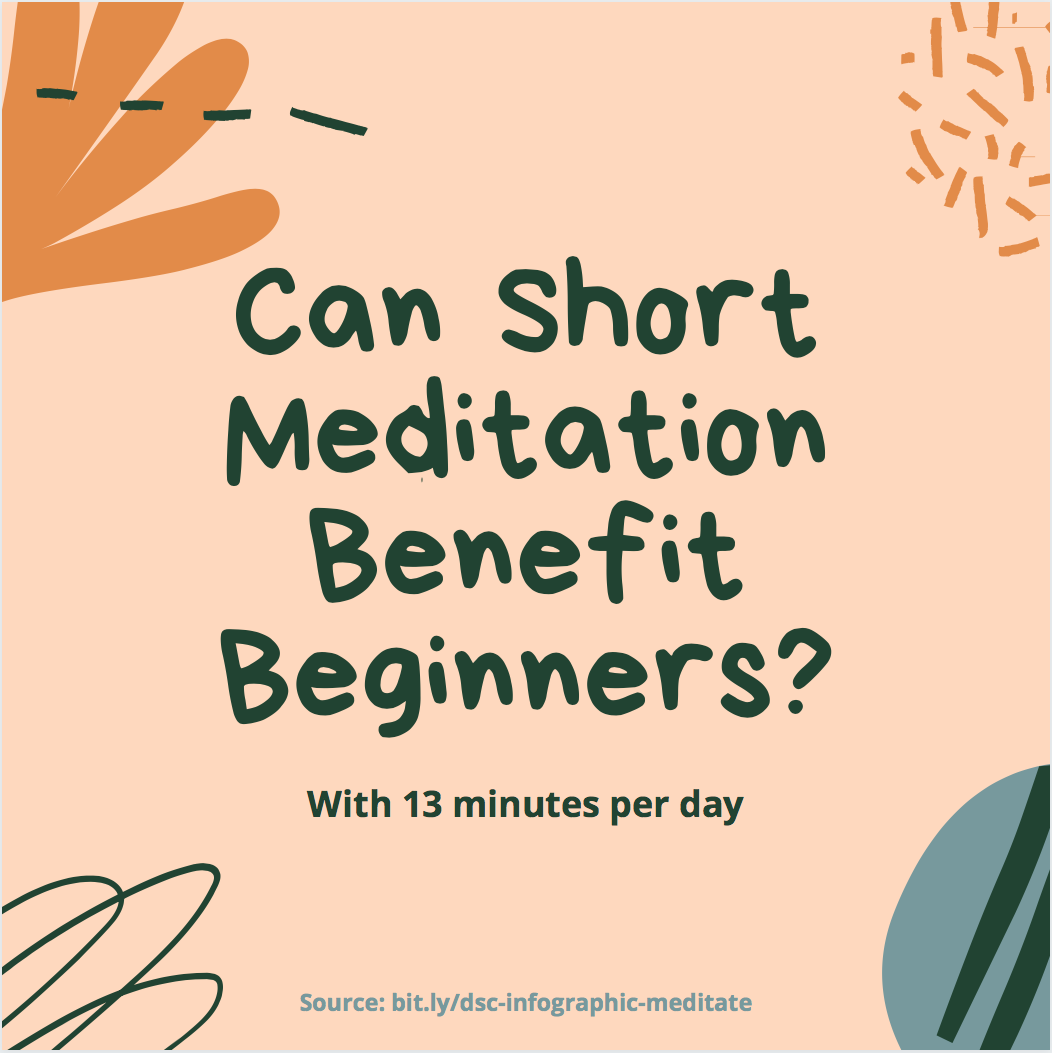 Double click on the text in the first page, “Tips on…”, and replace the text with, Can Short Meditation Benefit Beginners? And the small text below it can be replaced with: With 13 minutes per day.
 -
Click on Text in the left toolbar and then click on Add a subheading. In the text box that is added to your slide, write “Source” and then select the text to make the following changes to it. Change the font size to 18, set it to Bold, and change the color to one of the document colors. Move it into the top or bottom of the page. If you move it into the bottom, you will need to delete one of the clipart items so the text is readable.

-
The rest of the infographic will only require three more pages.
 Scroll down to select which three you want to keep and delete the others by clicking on the little trash can icon just above each page. For this example, we have kept one of each colour. You can also use the arrows above each page to change the order of the pages if you would like the pages to be in a different order, and add page titles at the top left of each page to keep things organized for more complex projects.
-
For this next page we are going to save some time and copy some work from a previous activity. If you go to the Canva homepage (you should already have a tab open for this, but if not, you can click on Home in the upper left corner), from there you will see in the left menu bar a section called All Your Designs. Click on this to bring up all your past Canva projects. Look for the infographic you made in the earlier activity. (If you skipped past the other activities, instructions for creating this bar chart can be found in Activity #2. You can build a similar bar chart in the Instagram Post instead.) Click on the individual elements of the bar chart while holding down the Shift key until you have selected them (bar chart, text labels) and then right click on them to bring up a menu and click on Copy, or Ctrl+C or Cmd+C to Copy them. Then go back into your new Instagram project and paste the bar chart into it. And then drag the handles on the corners to resize it larger.
-
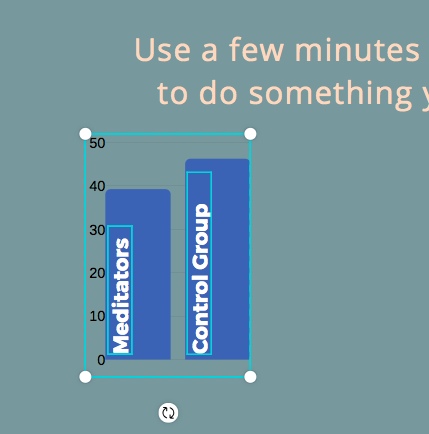
Click on the individual text labels over the bar chart and change the font to match the secondary font in this theme (Open Sans).
-
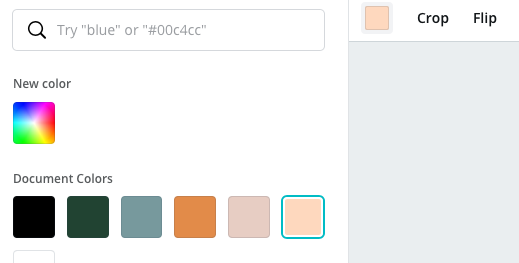
Click on the bar chart and change the colour to match the colour scheme of the theme by clicking on the colour tile in the top toolbar and then choosing a document colour (make sure it’s not the bright blue recently added from the bar chart, though).
-
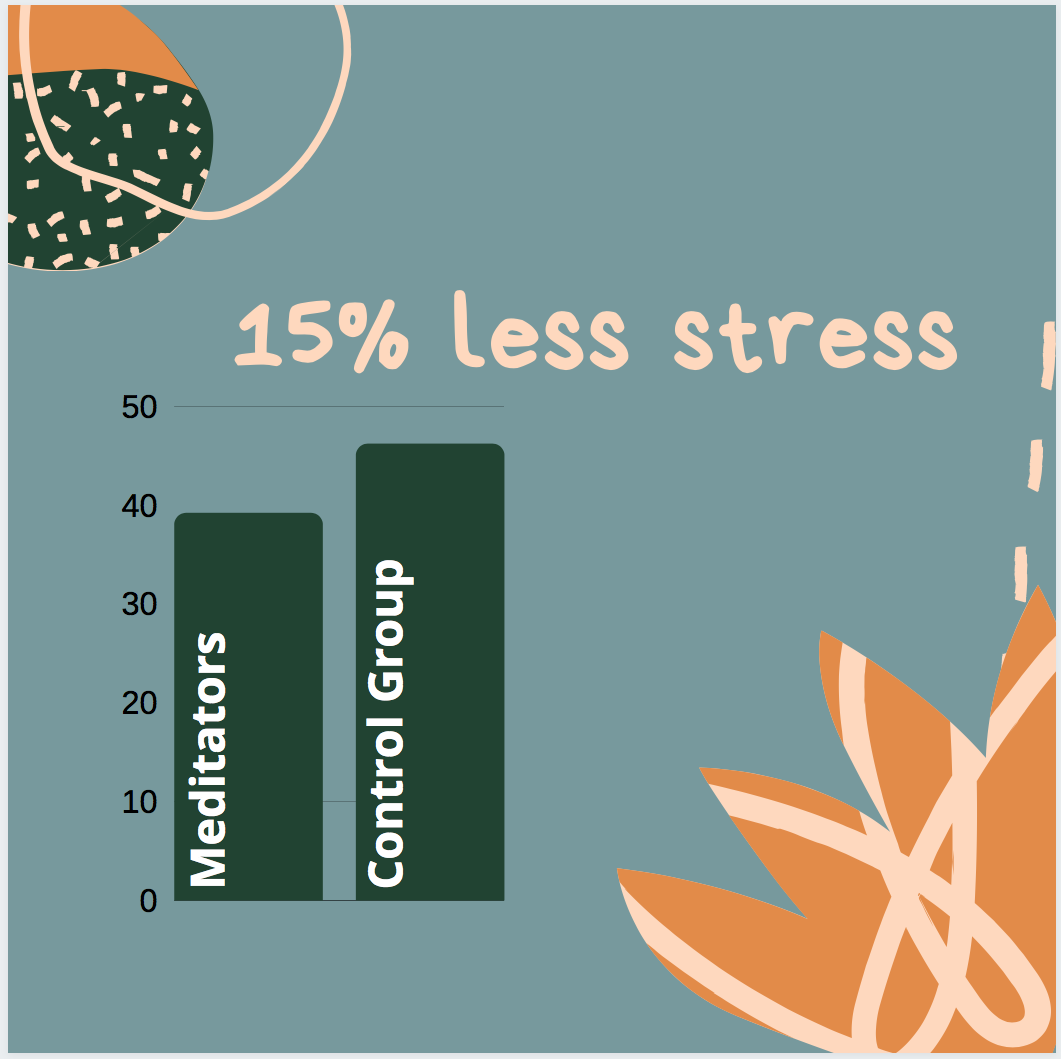 Change the heading text to 15% less stress and delete the other text. Feel free to move things around until you like where things are situated and resize text as needed.
 -
For the next page, change the header text to 40% better mood and delete the other text. You may want to add more graphics to this page.
-
Click on Elements in the left toolbar and search for Abstract to find clipart that is similar to the artwork featured in this them (alternatively, you can rework this whole theme and go with a completely different look – just remember that infographics are most effective when they have a cohesive look to them). Find some graphics and click on them to add them to the page and remember to change the colors to match the colour scheme.

-
For the last page, change the header text to 15% better short term memory and delete the extra text. Go back to the first page and copy the source information text box and paste it into the last page. Change the colour if needed and move any graphics around if this helps to make the text more readable. Note: If you create an infographic with multiple sources, you can create a page at the end that lists all of your sources.
-
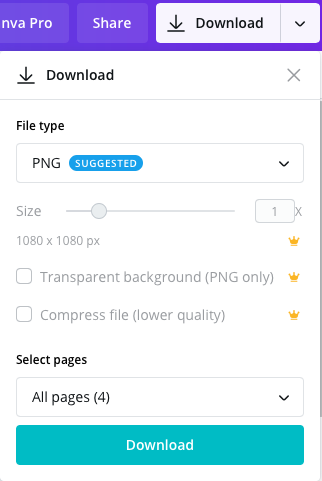
To download, click on the Download button in the top right corner and make sure All Pages is selected at the bottom. Then click the teal Download button.
-
Transfer the images to your phone to share on Instagram. _Tip: when sharing, make sure the pages are selected in the correct order (see numbers in the thumbnails in the Instagram screenshot below).