Graphics & Finishing Touches
Now that you have a title and a chart in your infographic, we’ll now add some more graphics and a QR code, and tidy things up before exporting. If you have any questions, please ask, and don’t forget to have fun!
- Searching for graphics:
- Click on Elements in the left toolbar and type in the upper search bar “lightbulb”. Look for a lightbulb that is simple and fits in well with the graphic style of the rest of the infographic.
- Click on the circle colour icons in the top toolbar to bring up the colour palette.
Choose colours that suit the rest of the design.
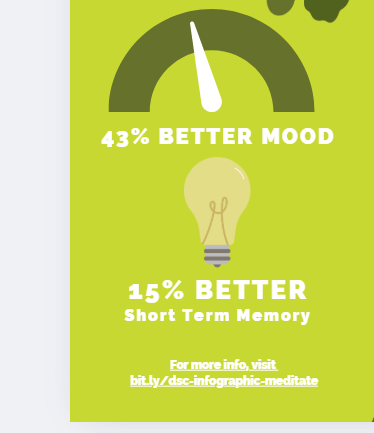
- Use text boxes to add the text below your graphic:
- 15% better short term memory
- 15% better short term memory
- Make Adjustments as Needed:
- Feel free to move your background tree and/or any of the text boxes and graphics around now that you have most of your elements in the design and have a better feel of how it all fits together.
- Make sure you save a little space at the bottom for a QR code.
- Add your source:
- Enter the URL for the source of this information at the bottom: bit.ly/dsc-infographic-meditate
- Create a QR code with the short Bitly URL (how to create your own bit.ly URL is in the Bonus Skills activity #4):
- Click on the black Apps button on the bottom of the left navigation bar (see image).
- Type QR Code into the search field and then press enter on your keyboard.
- Click on the black and white QR Code icon in the top left of the grid of search items and then click on the Open button that will appear.
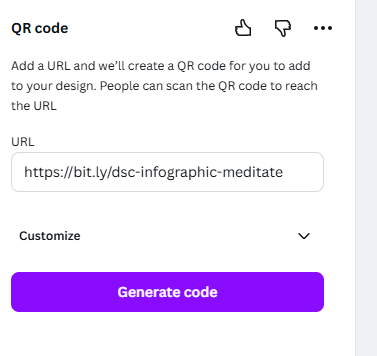
- Paste your shortened Bitly URL - (https://bit.ly/dsc-infographic-meditate){:target=”_blank”} - into the while field that appears, and then click on the teal Generate code button.
- Move the QR code that appeared on your infographic to the bottom right corner and resize it to fit the space available.
- Finishing Touches:
- Take a look at the overall image and notice any alignment or balance issues. Is the title over to one side? Is that really where I want the bird or that cloud? You can add little detail touches like pulling the bottom cloud forward (right click and Bring to Front) and making it larger so that it slightly overlaps the bottom square to create a sense of depth (see final example).

- Exporting & Publishing:
- To save your new infographic so that you can publish it where you want, click on the white Share button on the top right of your browser, and then click the white Download menu item. Save your infographic file in a location on your hard drive where you can find it later.
- Note: the PNG format is a good choice for a high-quality image you can use in a paper or post to social media. For poster printing, high-quality PDF is recommended.
Great Job! See the Take Home sheet and Extra Skills Activity sheet to build upon what you’ve learned here.