Edit DataFrame
1. Now that you have some understanding of your data, you can start to clean it. What columns, rows, and specific content would be useful in analysis?
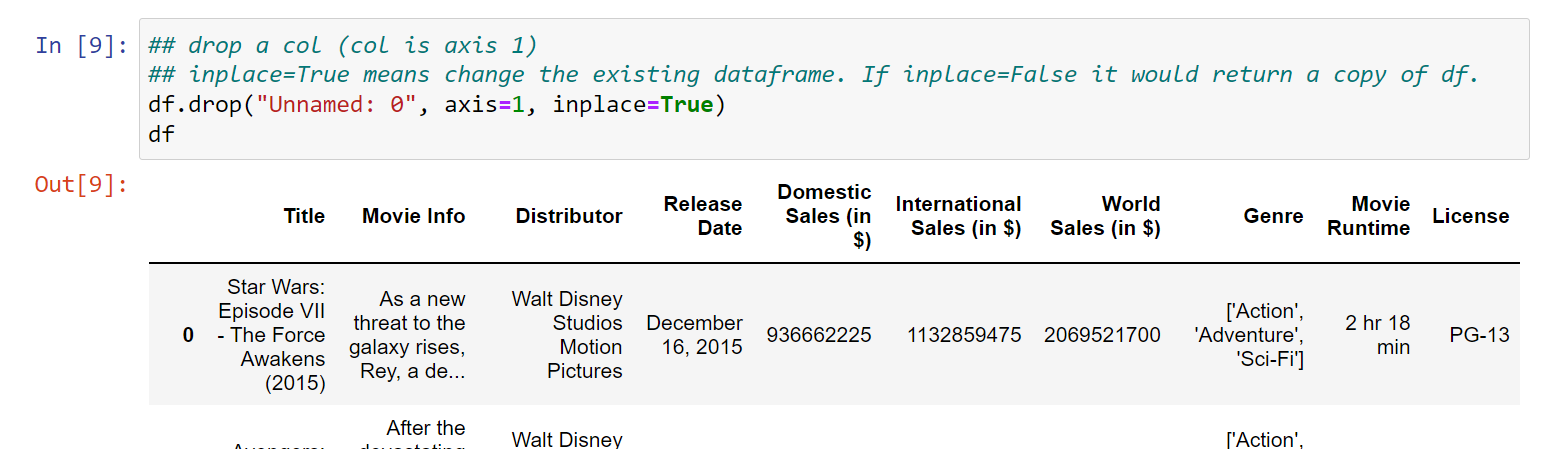
To start, the row “Unnamed: 0” is not necessary since it provides row numbers (indexes), something Pandas and Python does automatically as well. Use df.drop() to remove any unnecessary rows. The arguments to pass are:
- The name of the column as a string (I suggest copy and pasting from previous output)
axis=1indicates that the code should look for names in the column axis. Axis 0 is rows, and Axis 1 is columns in a 2-dimensional DataFrame (What this workshop focuses on).inplace=Truethe function will replace your existing DataFrame (if False it will return a copy)
Click for code help
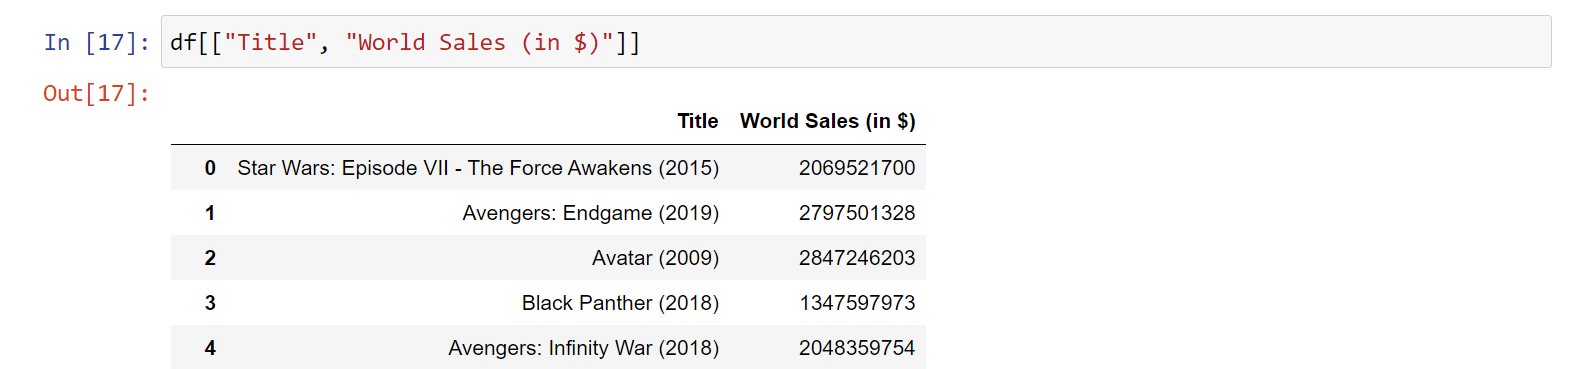
2. Choose 2 columns to explore the relationship between. At least one of the columns should be numeric so you can do quantitative analysis.
Make a new dataFrame with only those columns.
- Use a list with the name of the columns you want to keep as strings (I suggest copy and pasting from previous output)
- Use the list as an index/ slice in
df[](About)
Click for code help
3. Almost all real world data will have NA values. You need to decide what to do with them. In this case Use df.dropna() to remove NA variables.
Click for code help

4. Go to the Pandas Documentation and find another method to manipulate your data. you don’t have to replace your working DataFrame, you can just make a copy
Input and Run it in a new cell.