Load and View DataFrame
1.a. You can use your own data or the one provided.
Go to the linked URL, right click, select save as.
1.b. Upload Your CSV and start a new notebook
- Go to syzygy and look for your institution under “LAUNCH”. Login using your institutional credentials.
- Your launch screen should have 2 sections. Your files/ directories on the right and the “launcher” on the left.
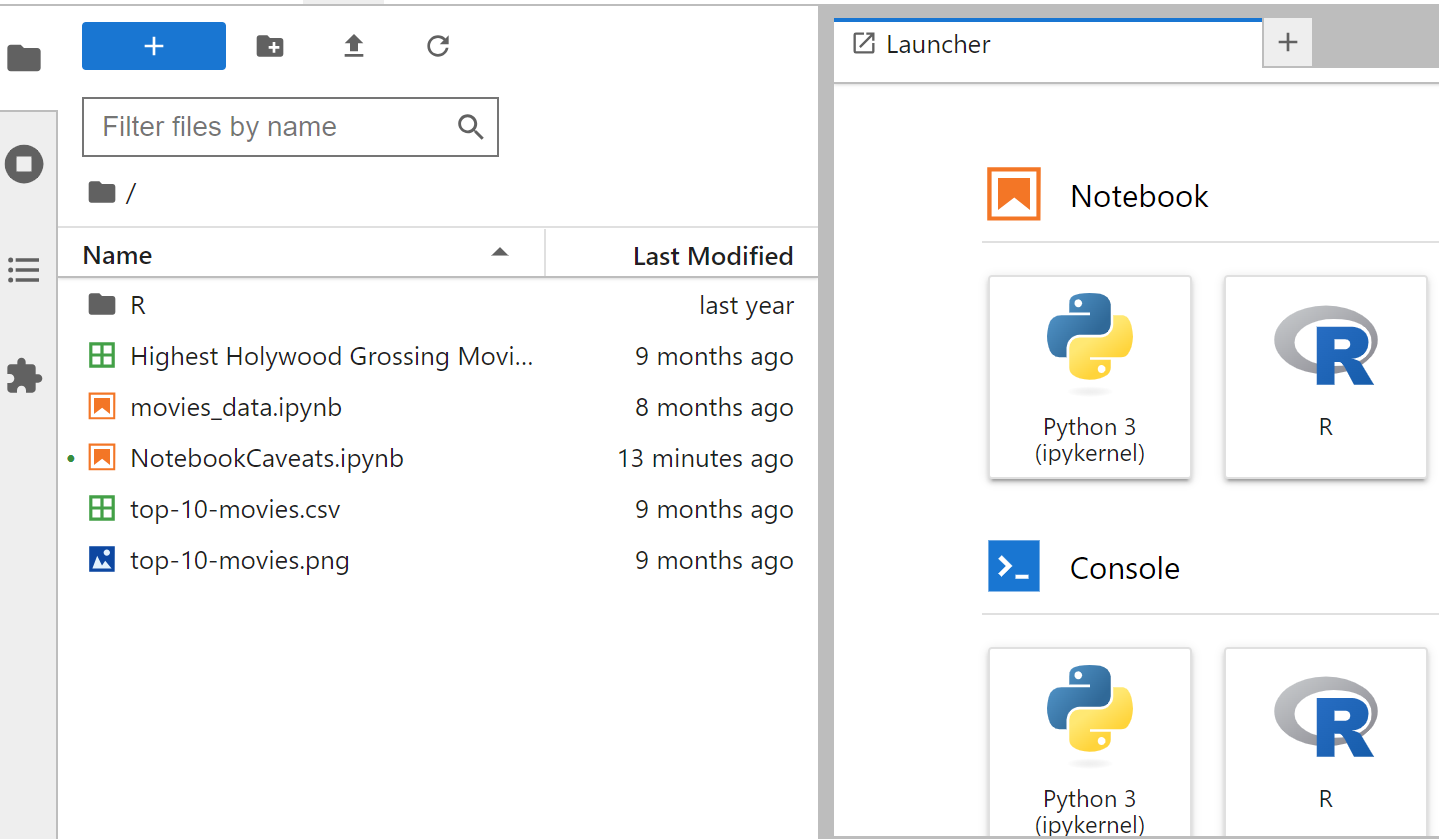
- Select the upload button on the files side (right) and select your data file from step 1.a.

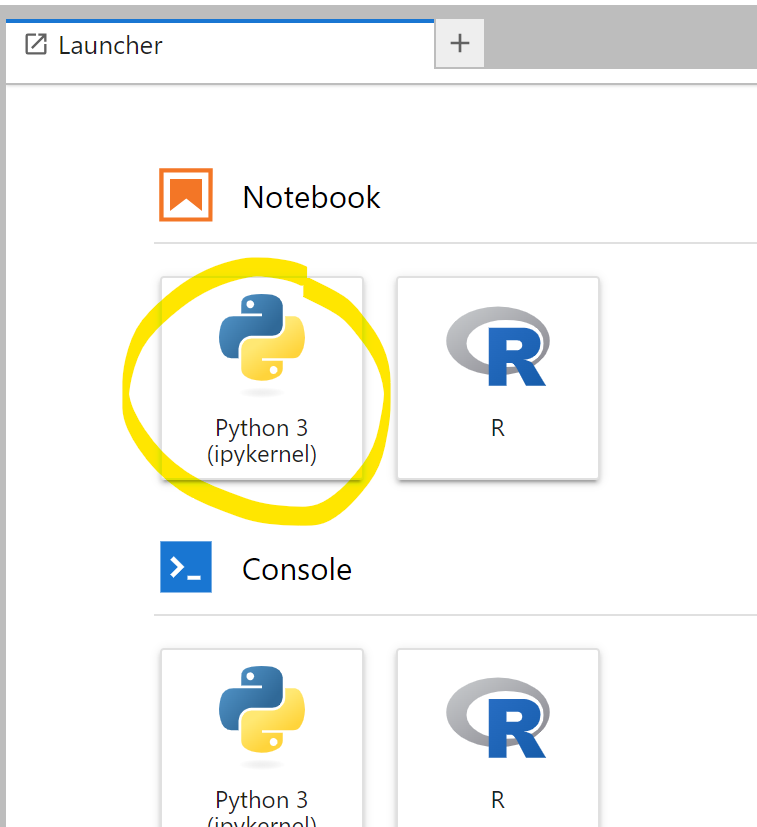
- open a new Python Notebook by clicking on Python 3 (ipykernel) under the Notebook section on the Launcher side (left)
Make sure your data file and notebook are in the same folder/ directory!
2. Import the pandas library by typing import pandas as pd in the first cell (I name it “pd” because that’s common on help forums)
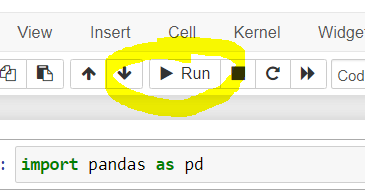
3. Run the cell that you just wrote in:
- Make sure it is selected (it should be outlined with a blue or green bar next to it)
- Click on Run in the top navigation pane
Show/Hide Animation
4. Load your data as a Pandas DataFrame using pd.read_csv().
- Inside the brackets, the first argument, write your csv file name in quotes (as a string).
- The second argument you can include is
header=0which tells the method that your data has headers on row 0.
I call the DataFrame df because that is convention in documentation and help forums, but you can call it whatever you’d like.
Click for code help
"header = 0" tells the function that your data has headings on column 0

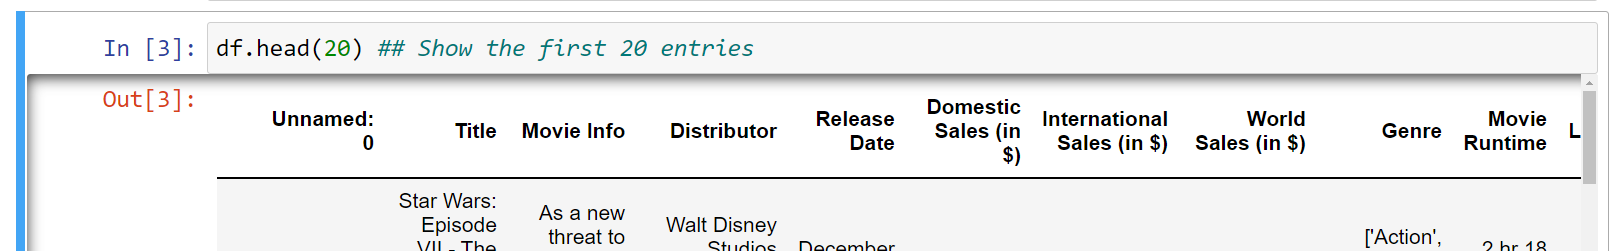
5. View the top items in your DataFrame using df.head(). by default, head() shows the top 5 rows of your DataFrame, but pass it any number (less than the number of rows you have) to show more.
Click for code help
6. Start to understand your data by viewing some of it’s attributes and methods
Make a new cell and Input df.shape. Run the cell. This returns a tuple with the first value being the number of rows, and the second value being the number of columns see in docs
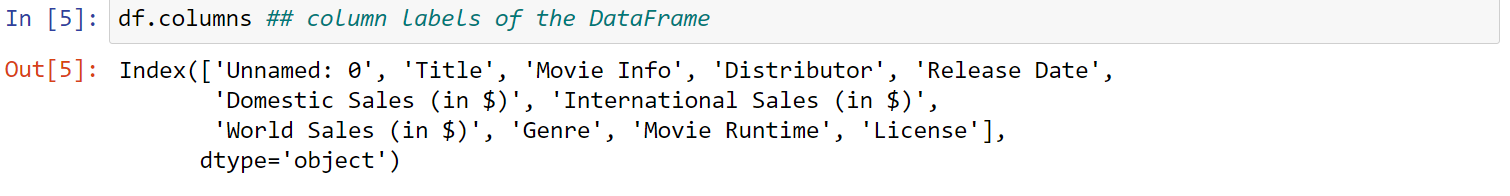
Make a new cell and Input df.columns. Run the cell. This returns the name of the columns, or the headers see in docs
Make a new cell and Input df.size. Run the cell. This returns the number of items in your data frame (number of rows x number of columns) see in docs
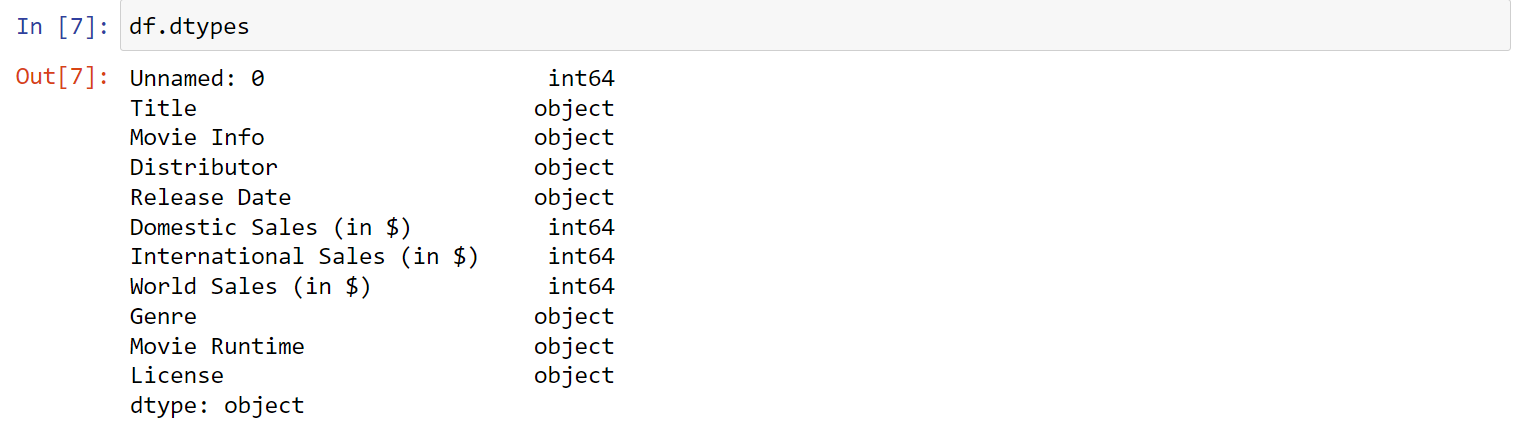
Make a new cell and Input df.dtypes. Run the cell. dtypes are the python data type of the values in a cell and also help describe the size of the data. Columns with mixed types are stored with the object dtype. see in docs
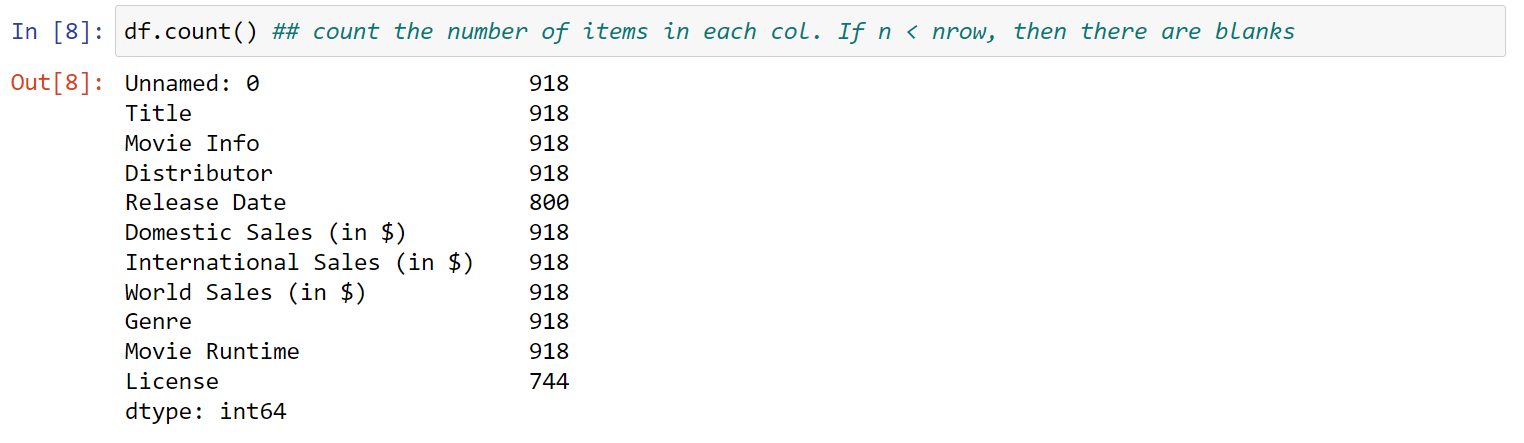
Make a new cell and Input df.count(). Run the cell. count the number of items in each col. If the total number is less than the number of rows, then there are blanks. see in docs
Click for code help


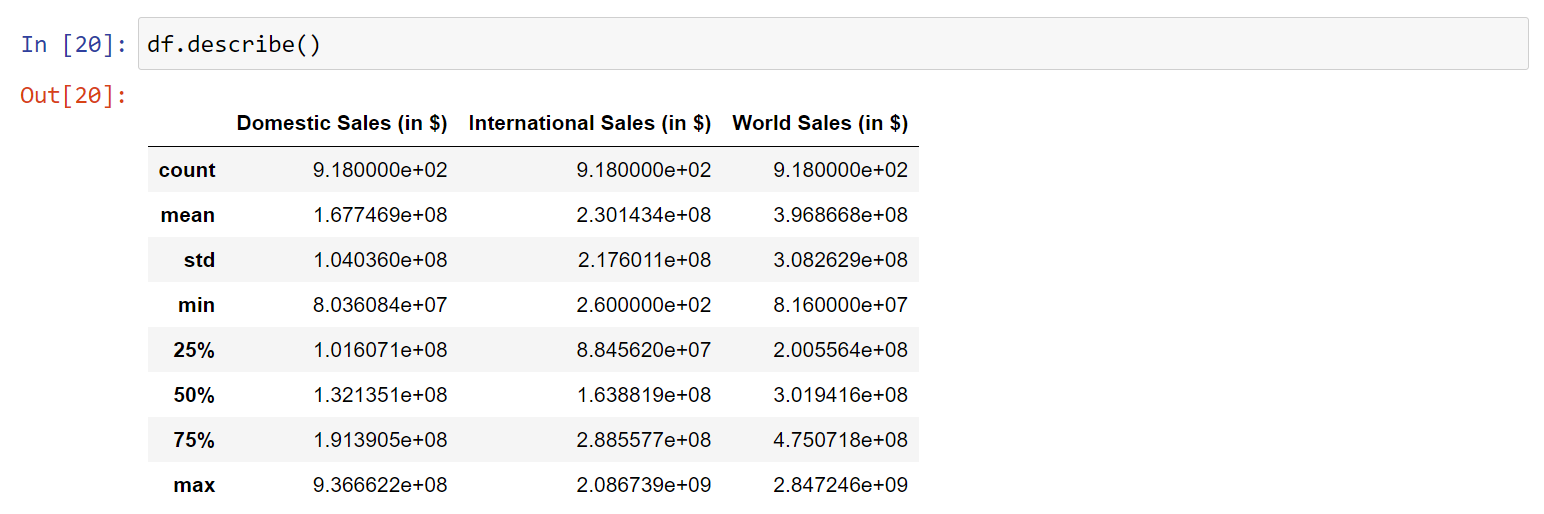
7. View descriptive statistics with df.describe(). This will automatically calculated descriptive statistics using the numeric type rows in your DataFrame
Click for code help
8. Go to the Pandas Documentation and find another attribute or method that helps describe your data
Input and Run it in a new cell.