Make Your Own Weather Station
Adapted from Adafruit IO: Basics - Temperature and Humidity by Todd Treece
If you or your group have any questions, or get stuck as you work through this in-class exercise, please ask the instructor for assistance. Have fun!
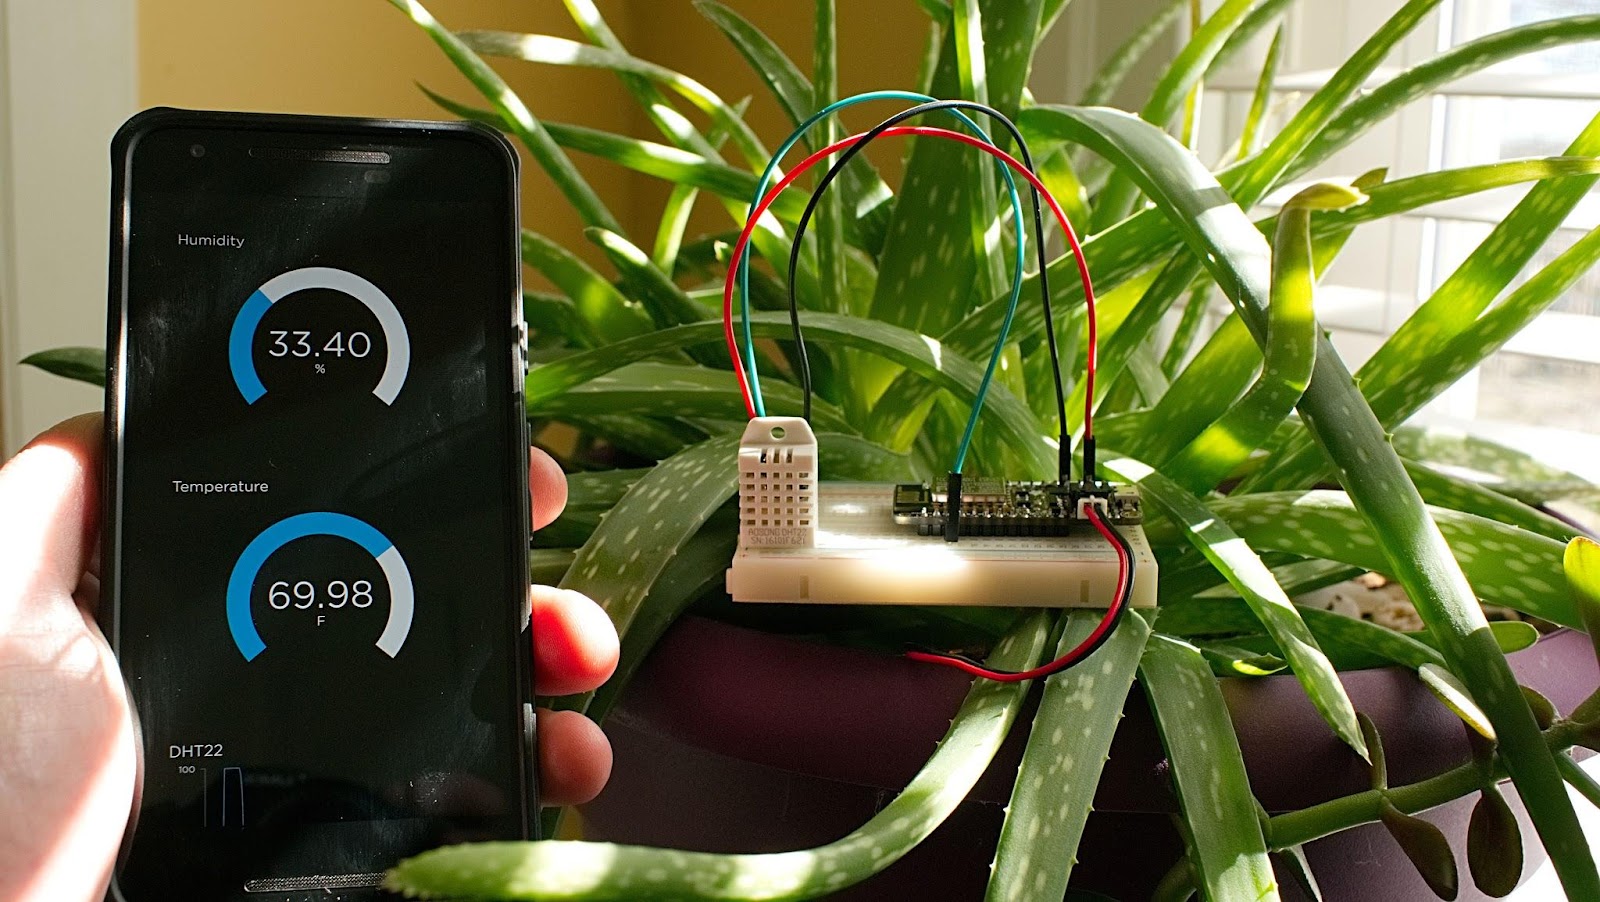
In this tutorial, you will learn how to make a simple weather station that detects temperature and humidity
List of Materials
- Adafruit Feather HUZZAH board, breadboard, USB cable
- 1 AM2302 DHT22 Temperature and Humidity Sensor
- 4 jumper wires - 1 long red and 1 long black wire recommended but not essential
-
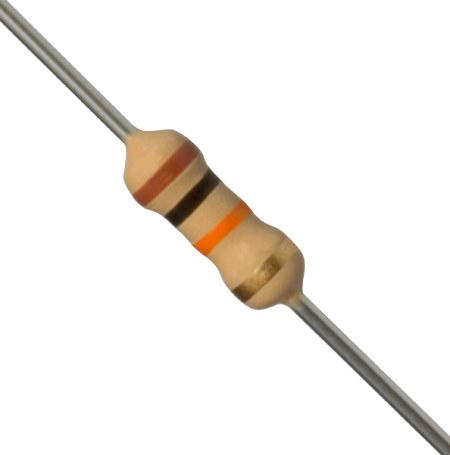
1 10k ohm resistor (brown black orange)
Instructions
-
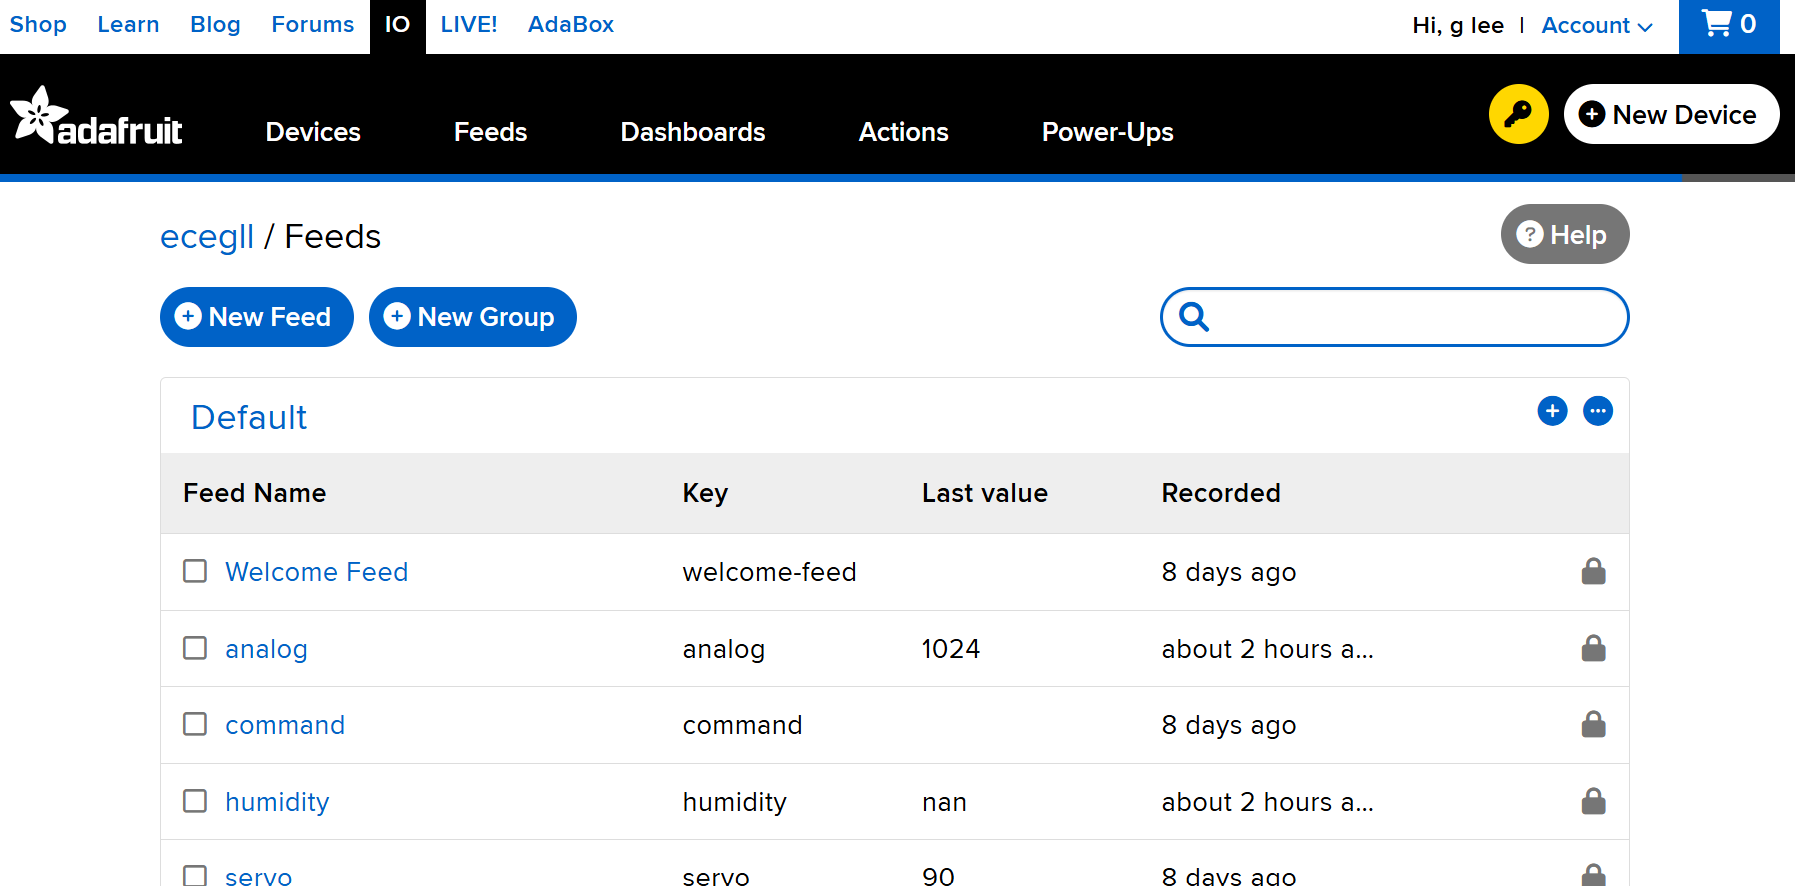
Log into https://io.adafruit.com (if you haven’t created an account yet, you can do that now). Along the top menubar, click IO and then click Feeds. Click + New Feed. Let’s create two feeds: one for temperature (name it “temperature”) and one for humidity (name it “humidity”)
-
Go to Dashboards on the top menubar, then click + New Dashboard. Name the new dashboard anything you want (for example, “environment sensor”). Once created, the new dashboard will appear on the page. Click on the name of your new dashboard
- For now, the dashboard is blank. In step #4 we’re going to add 3 different blocks. A block displays some kind of data coming from the Feather to Adafruit IO or vice versa
- A gauge for reading temperature
- A gauge for reading humidity
- A line graph for comparing the two over the last 24 hours
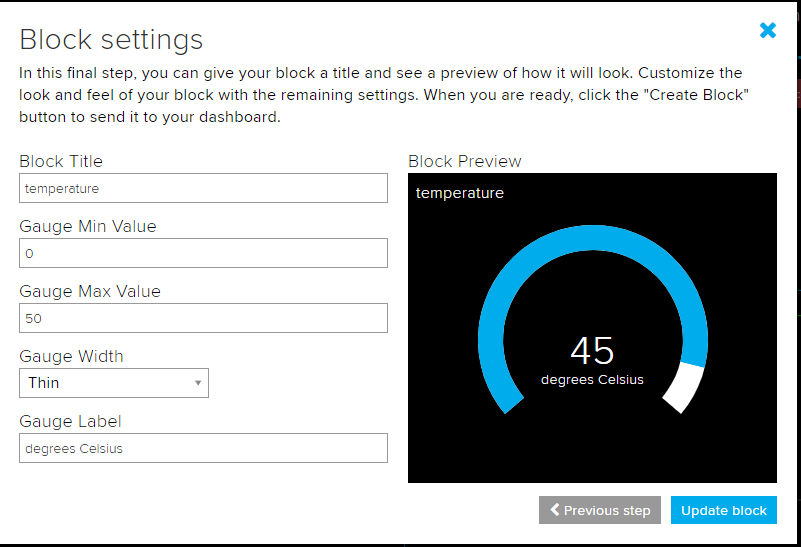
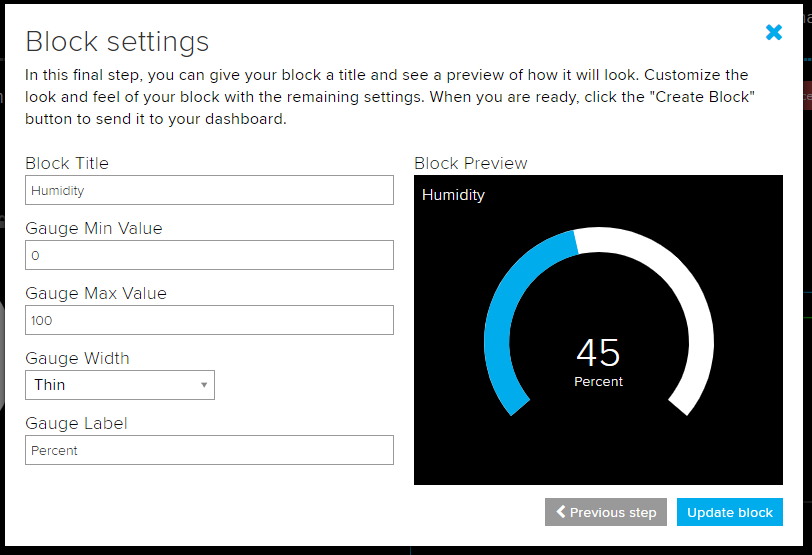
- Click the gear dropdown in the top right and then click + Create New Block to add each block to your dashboard. Add the temperature and humidity gauges, selecting the appropriate feed to read your data from. Fill out the settings as pictured below
- Create a Line Chart to witness a trend. Select 8 hours and 0 decimal places in the settings window and click Update Block
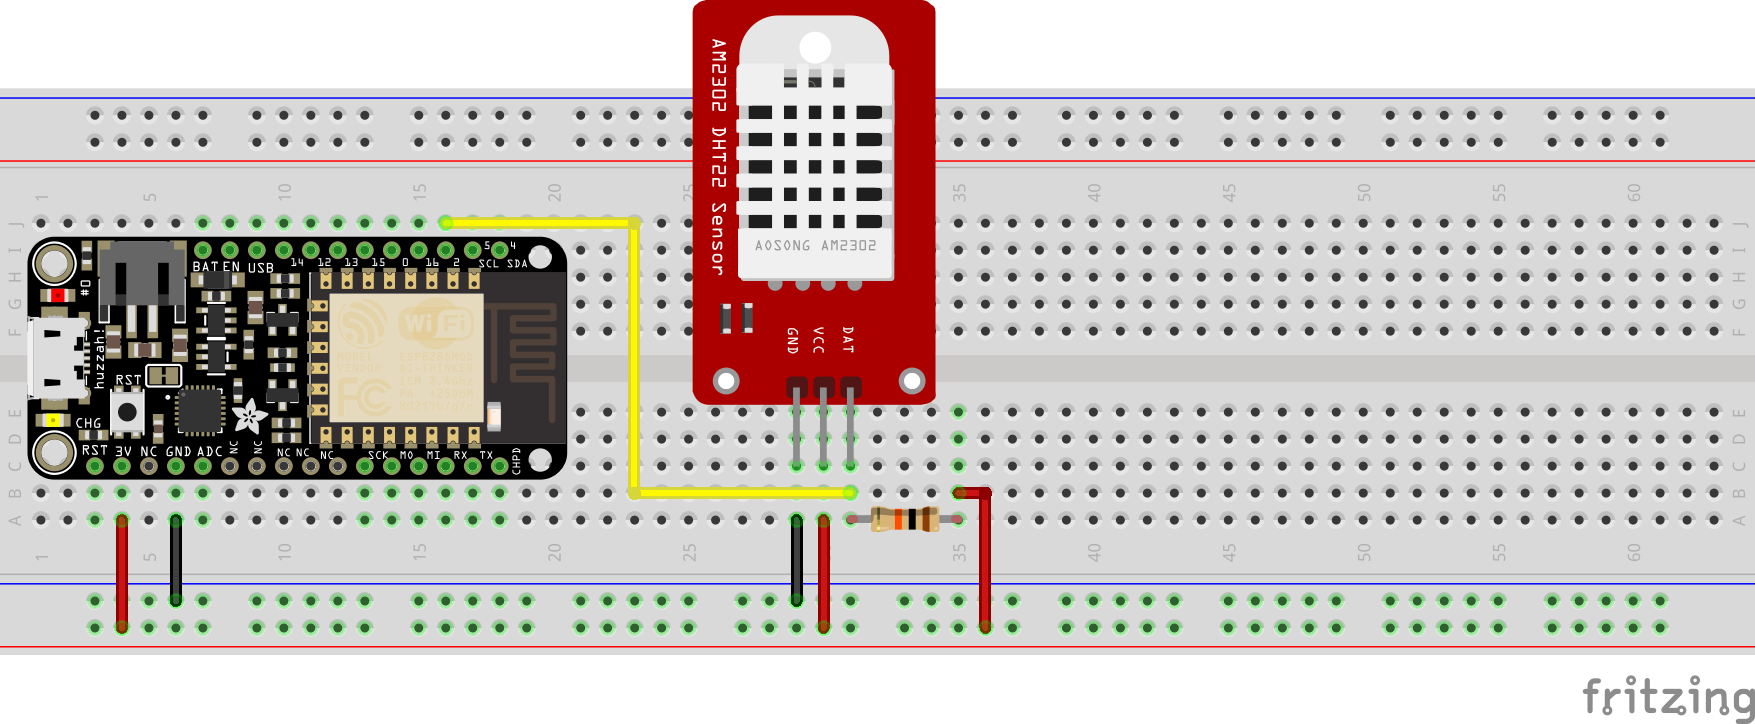
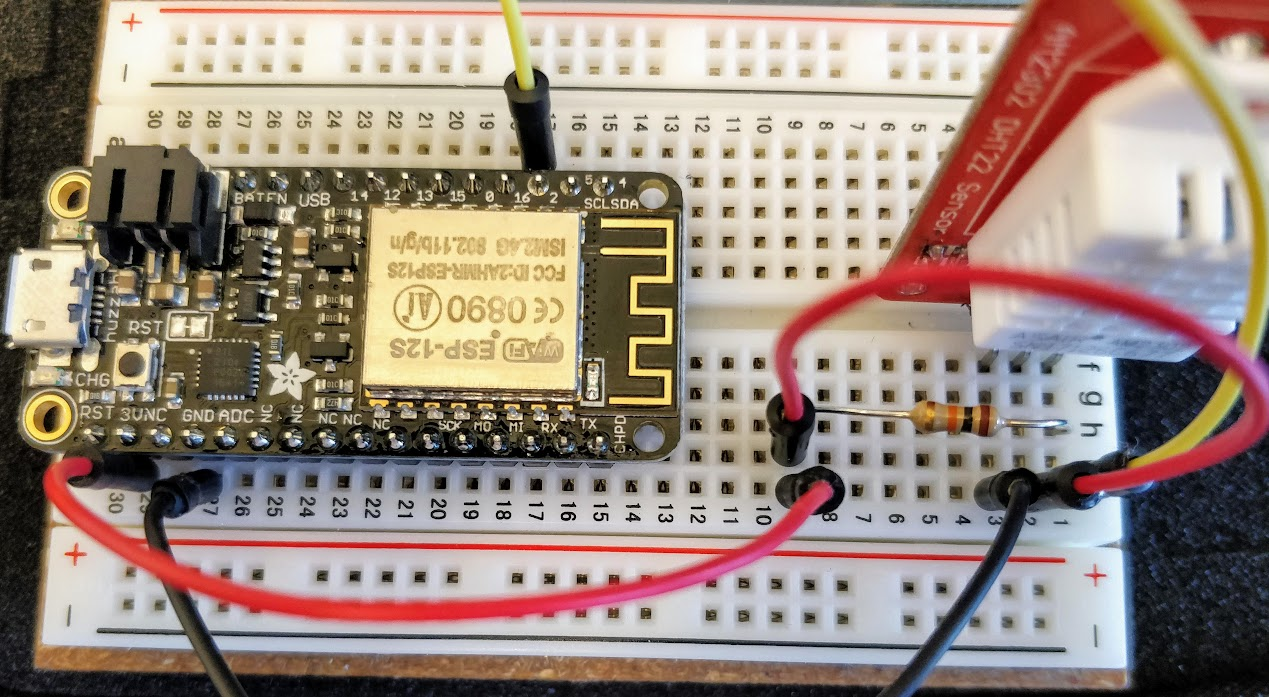
- Unplug the Feather from your laptop. Now we’ll wire the circuit. Remember that everything on the same row (A-E or F-J) is connected.
- Place the Feather Huzzah on the far left of the bread board as you can see above
- Place the temperature and humidity sensor somewhere to the right of the Feather
- Connect the GND pins of the Feather and the sensor together
- Connect the VCC pin of the sensor to the 3V pin of the Feather
- Connect the DAT pin of the sensor to IO pin 2 of the Feather
- Tie the DAT pin of the sensor to 3V using the 10k ohm resistor as a “pull-up” resistor
- Open the Arduino software. Make sure you have the correct libraries installed (if not, ask an instructor). Go to File > Examples > Adafruit IO Arduino > adafruitio_15_temp_humidity. A new sketch should pop up. A sketch is a program or batch of instructions for our Feather HUZZAH
- We need the DHT sensor library. Go to Sketch > Include Library > Manage Libraries
- Type “DHT sensor” into the search box. Select DHT sensor library and then click Install (bottom right corner)
- Type “adafruit unified sensor” into the search box. Select Adafruit Unified Sensor (you may need to scroll down), and then click Install
-
We’re almost there but we need to make a few modifications to the sketch. This sketch displays the temperature in fahrenheit but we want it to be in celsius instead. Scroll down until you find the following lines:
 // save fahrenheit (or celsius) to Adafruit IO
 temperature->save(fahrenheit);
Delete fahrenheit in
save(fahrenheit);being sure to leave the brackets intact. Replace it withcelsius, using all lowercase letters - Next, we need to be able to connect to WiFi and our Adafruit account. Click on the config.h tab. In the Arduino program on your laptop, fill in the 4 lines of info as we did at the start of the workshop
- Connect Feather to your laptop and make sure the right Board and Port settings are selected. Click upload (the right arrow icon in the top left corner of the window). After uploading the code to the Arduino board, on the IDE menu, click the Tools-Serial Monitor to show the serial port output information to debug.
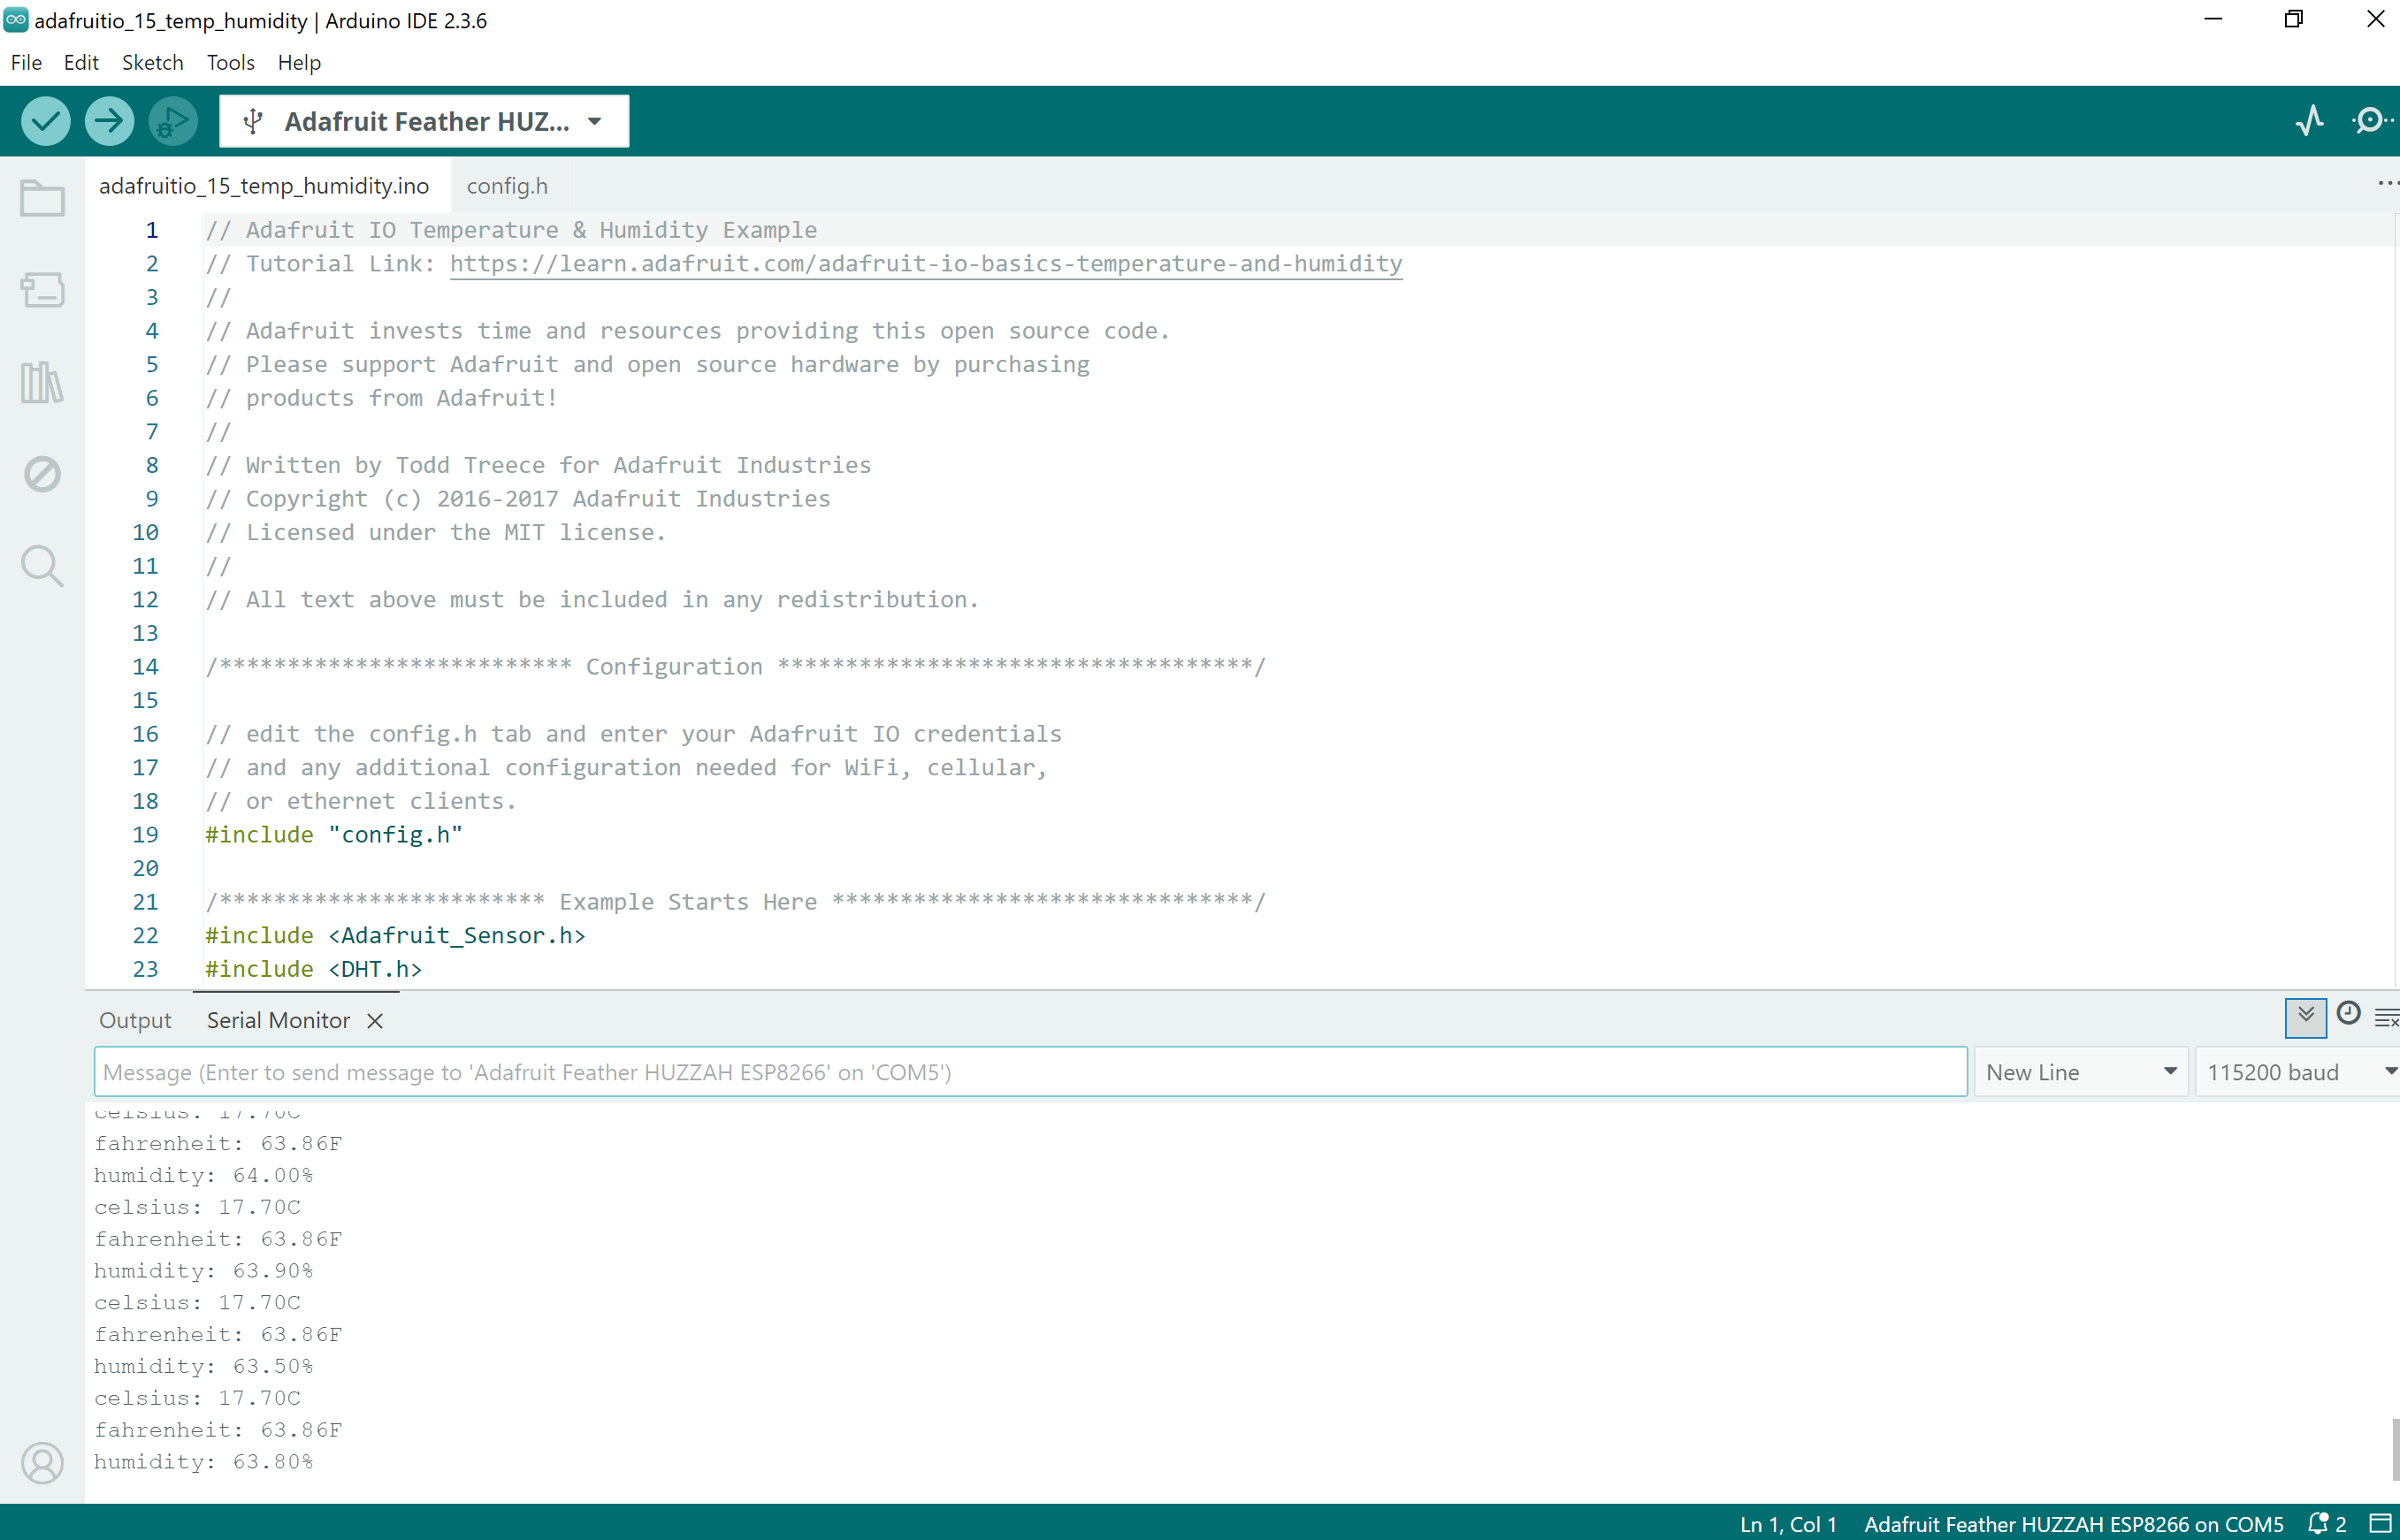
If the IDE could print out the serial information as above, our gauges should now display the temperature and humidity!
- Let’s add a couple of line charts for both temperature and humidity:
- Click on the gear dropdown again, click + Create New Block, and select the Line Chart option. Select temperature, and play around with the options to see what works best. For example, I liked to set the Y-axis Minimum to 0 and the Y-axis Maximum to 33(for celsius) or 100 (for fahrenheit).
- Click on the gear dropdown again, click + Create New Block, and select the Line Chart option. Select humidity, and play around with the options to see what works best. For example, I liked to set the Y-axis Minimum to 0 and the Y-axis Maximum to 100
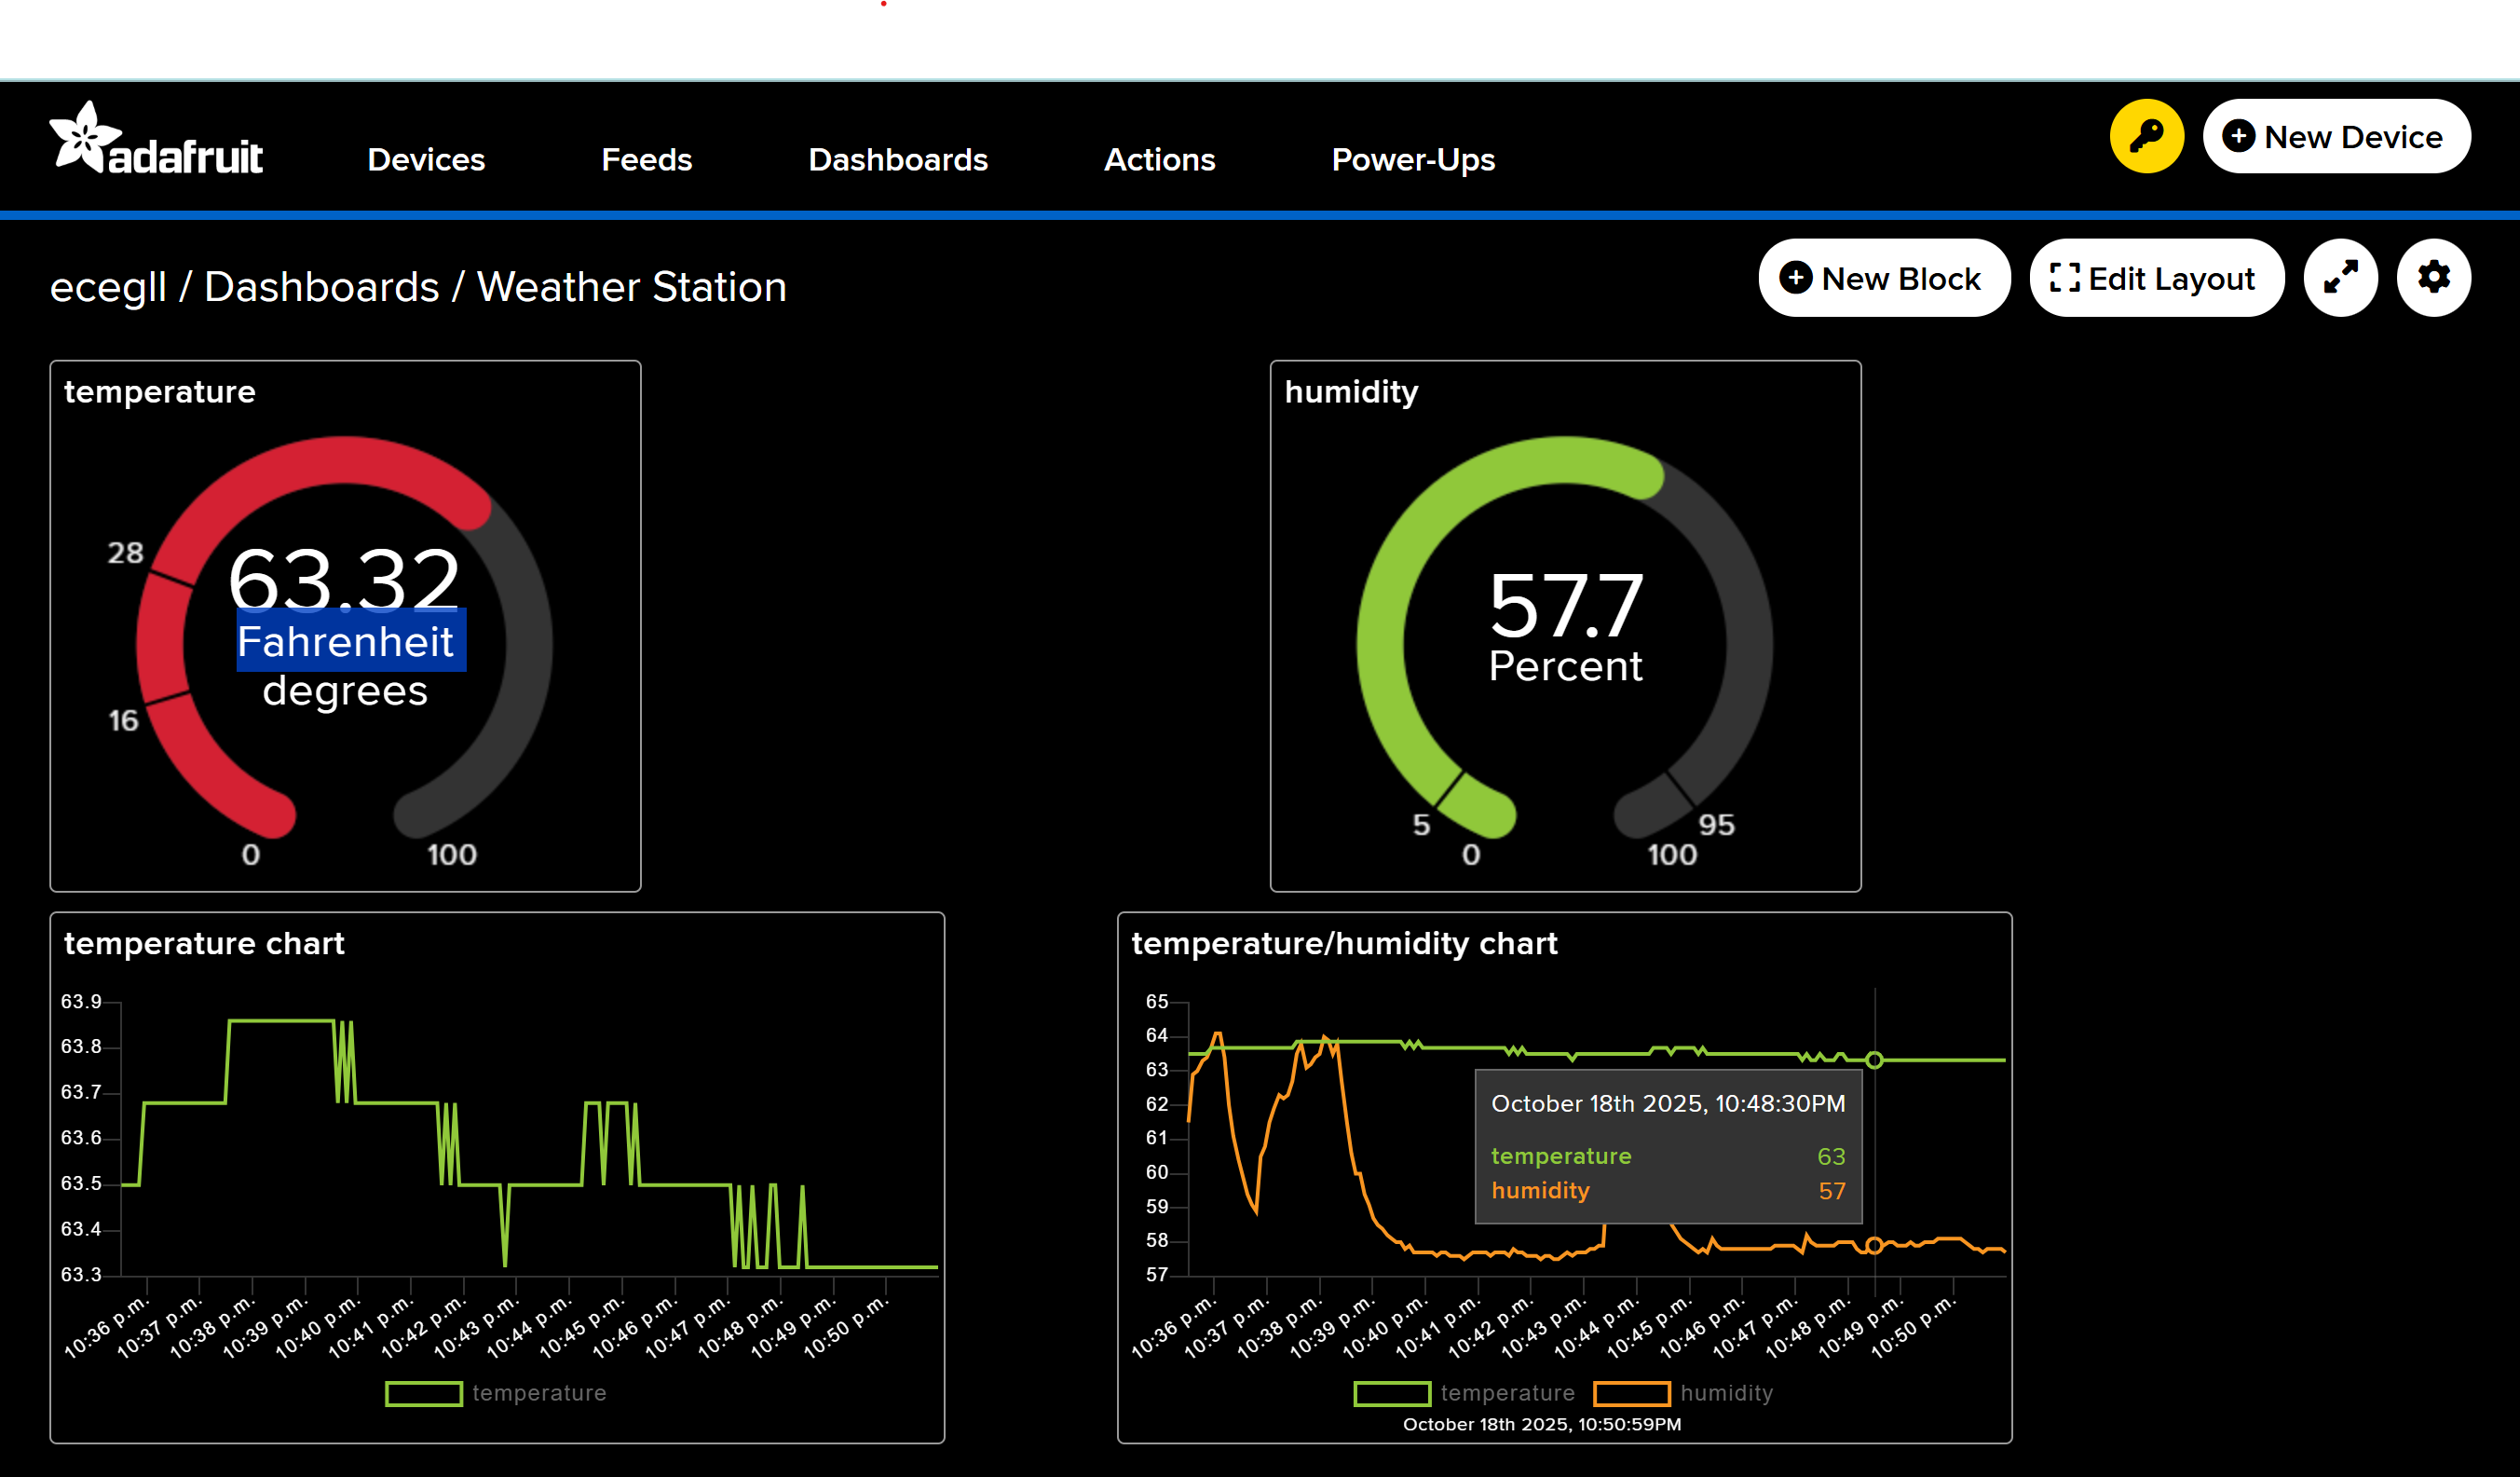
Double click the temperature block, it will show more details on the temperature sensor block 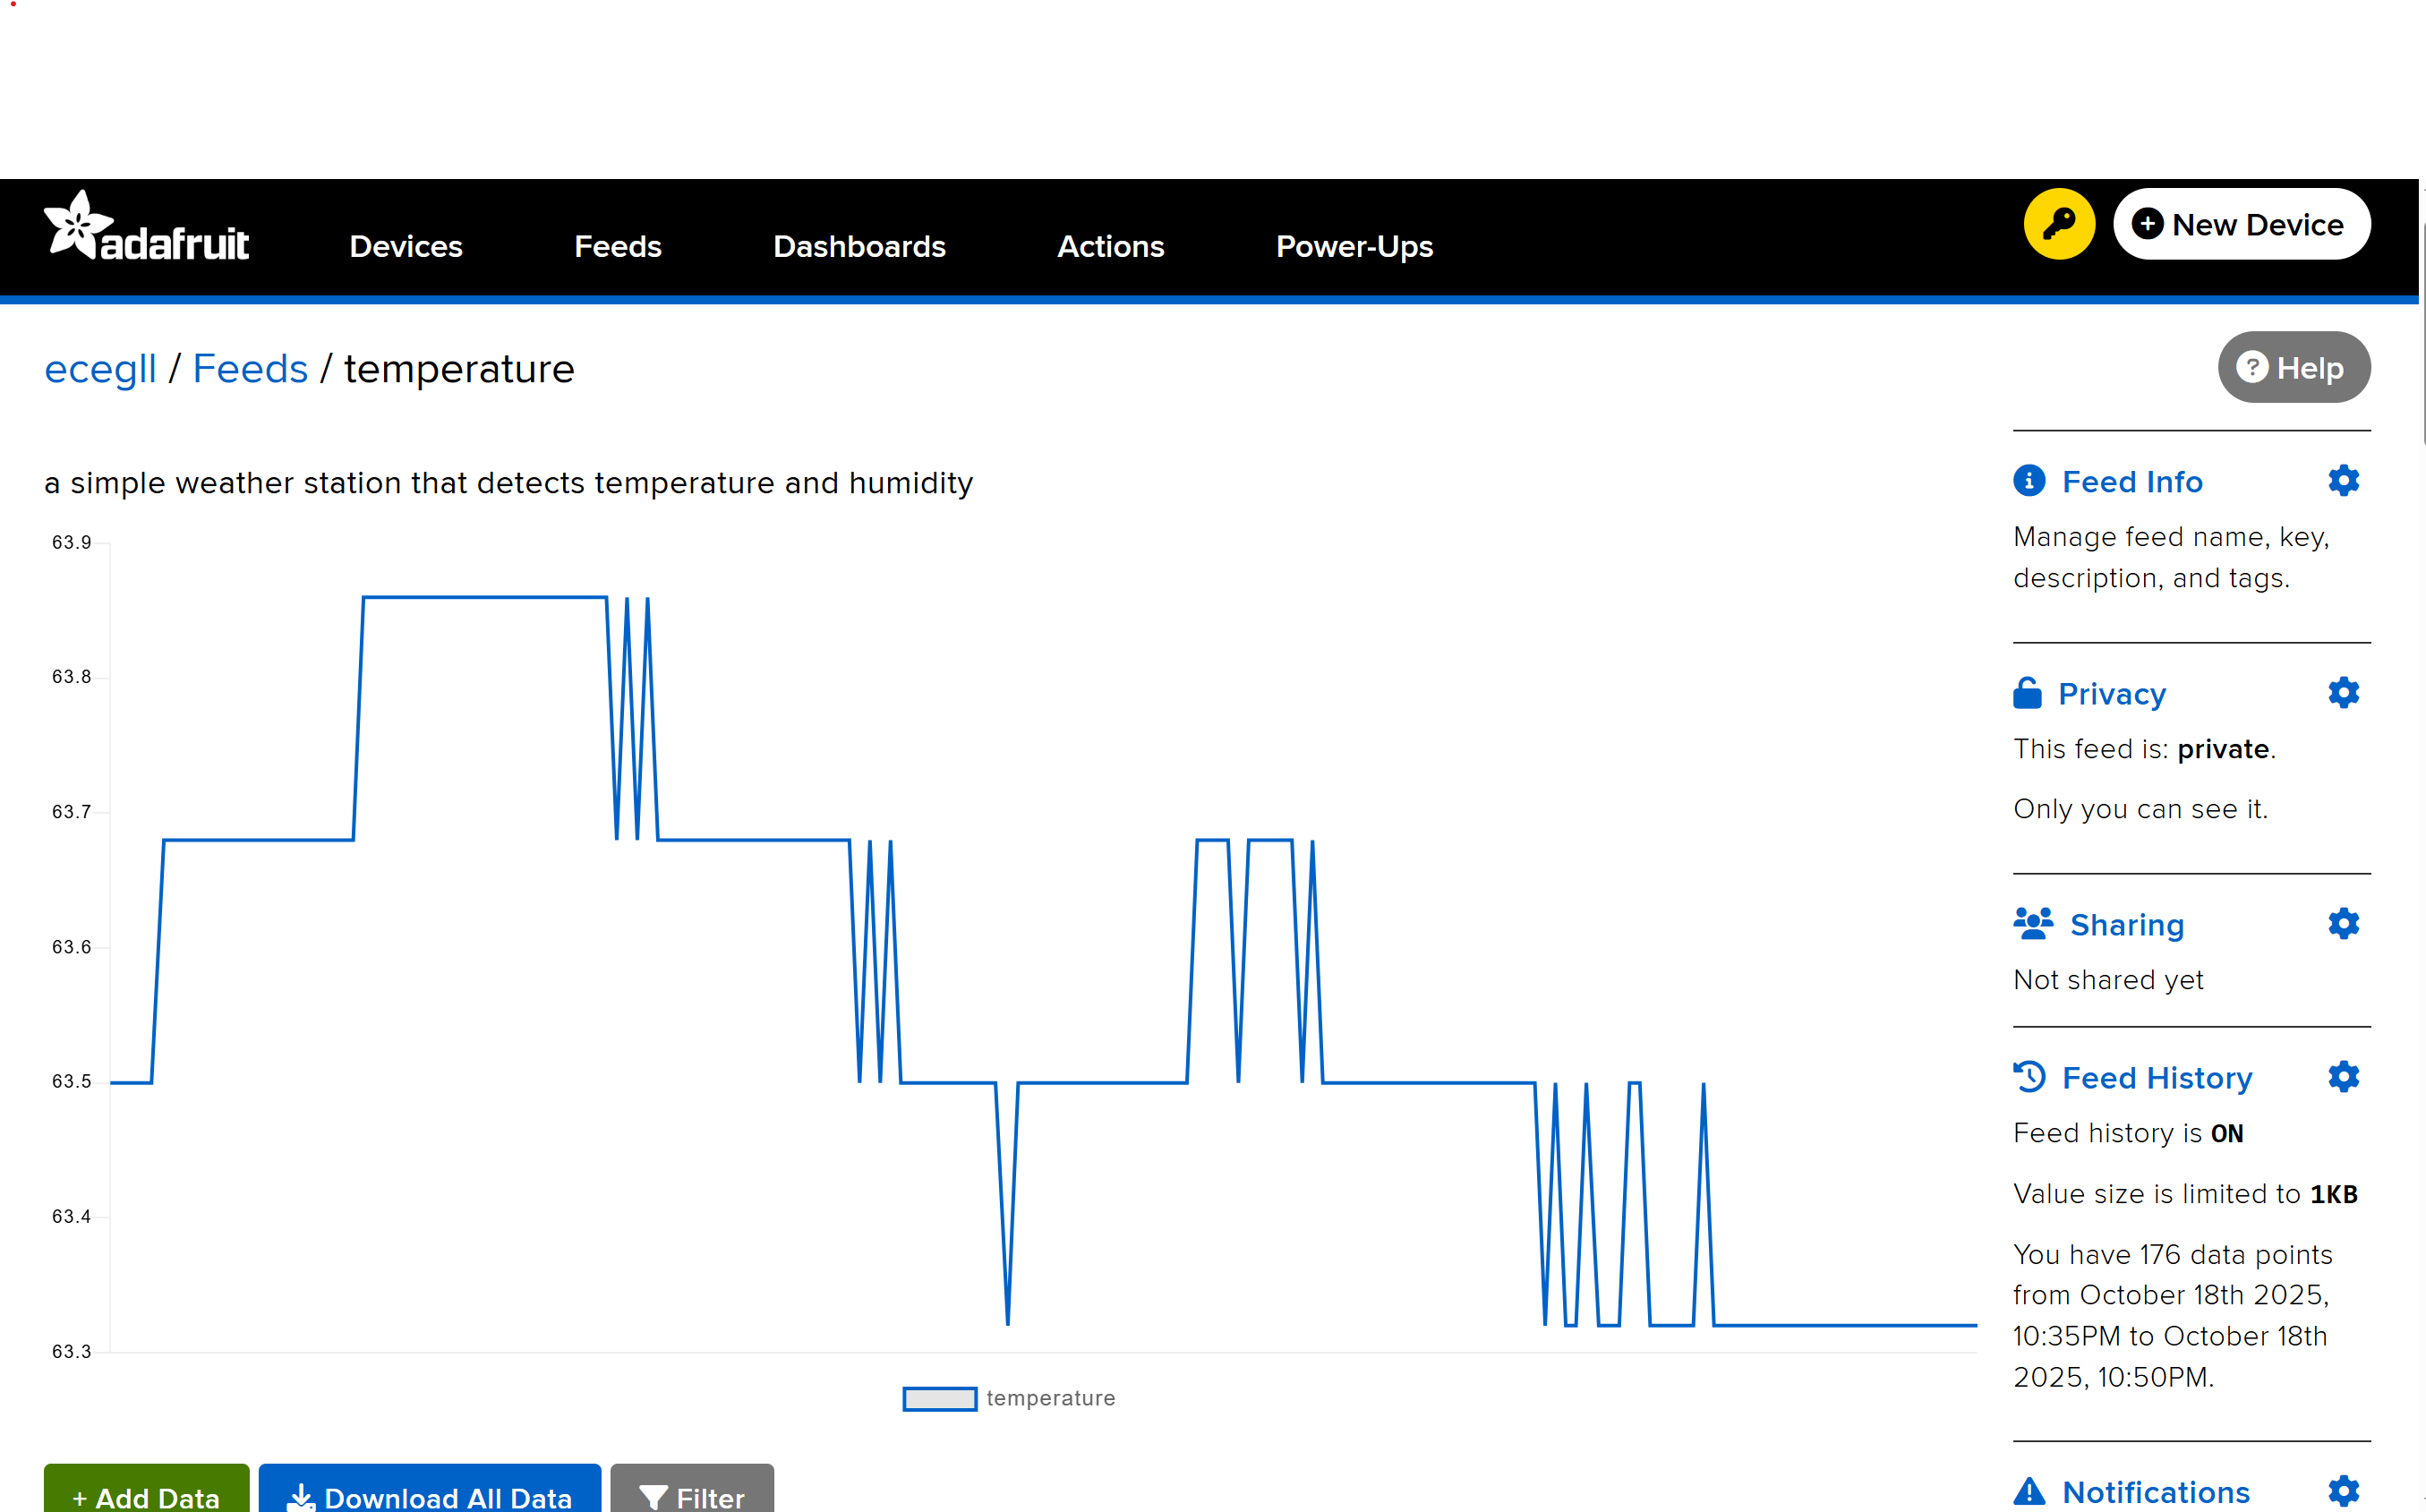
Congratulations, you’re done!